Visualizations atlas
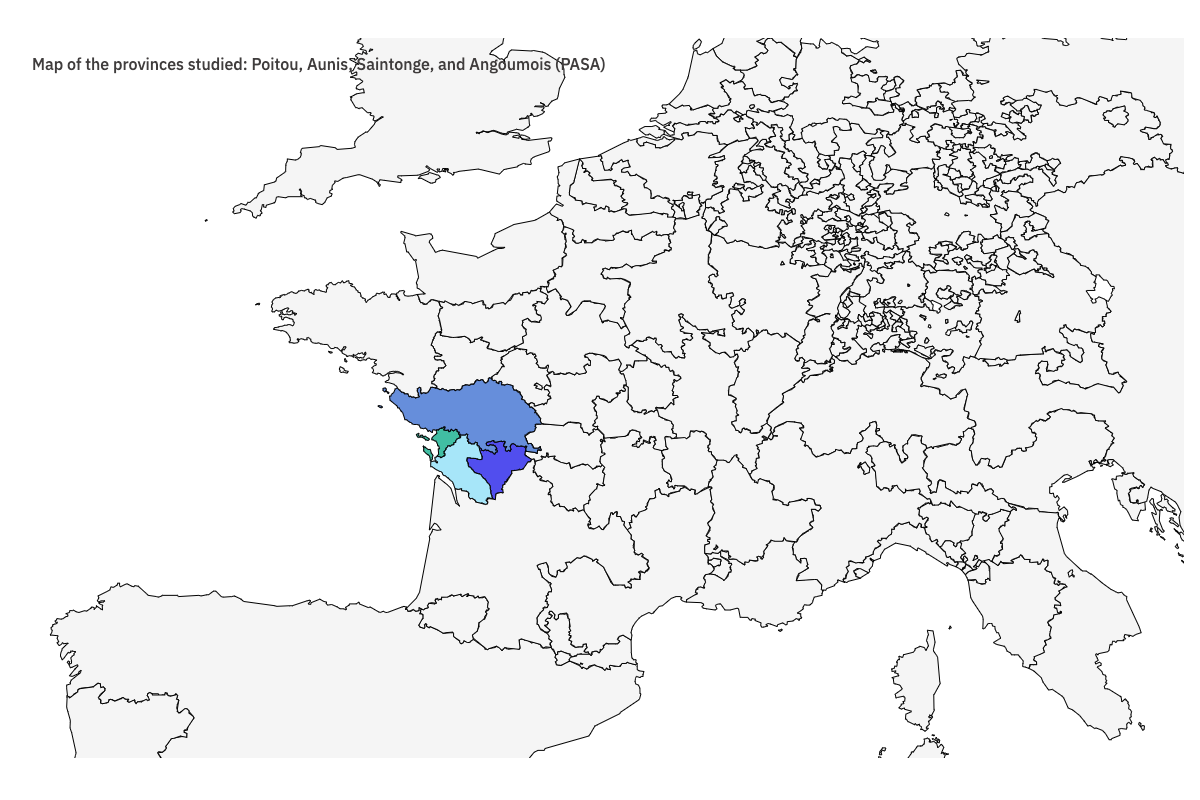
Map of the provinces investigated : Poitou, Aunis, Saintonge, Angoumois (PASA)
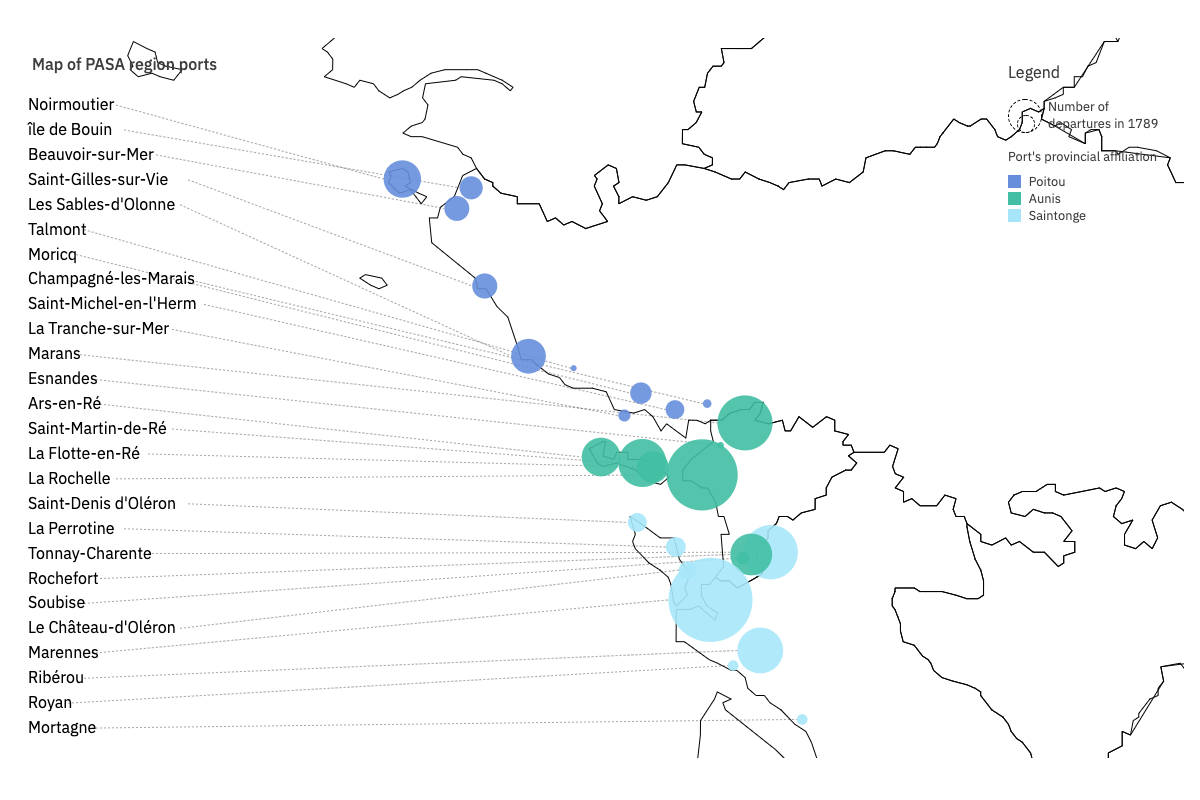
Map of PASA region ports
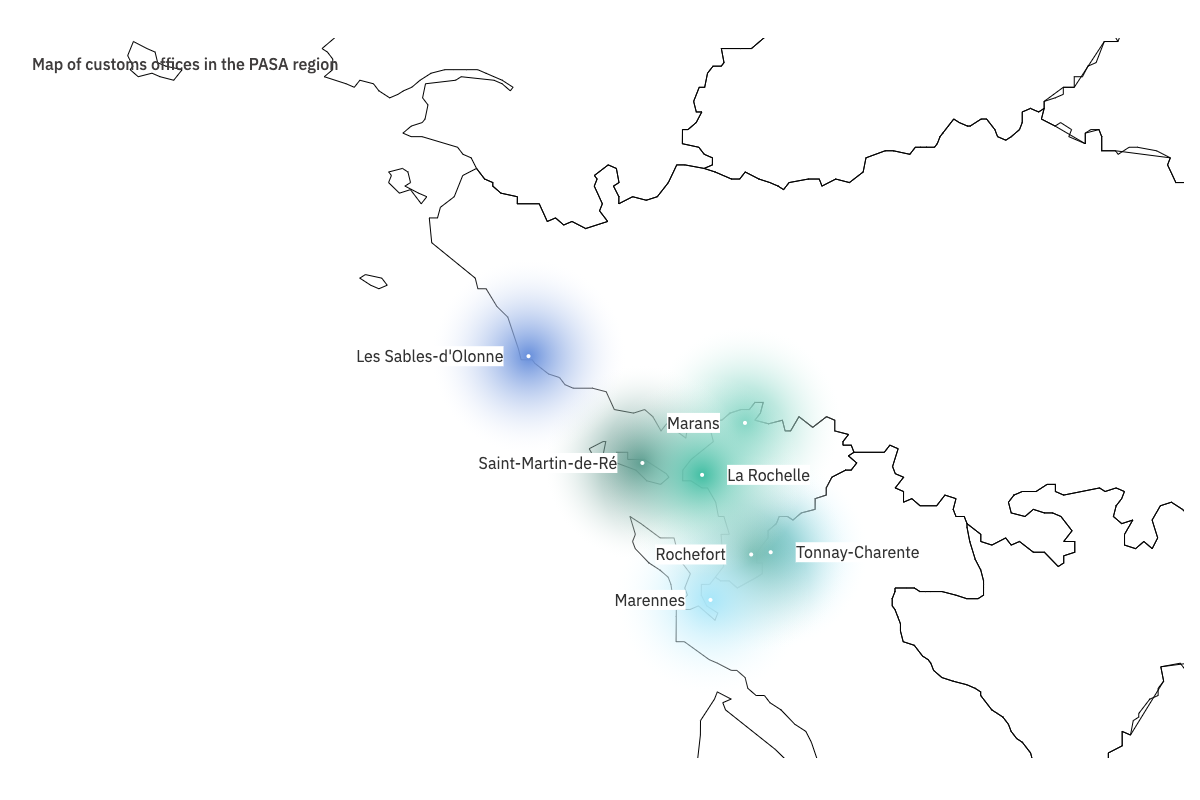
Map of customs offices in the PASA region
The decline of the La Rochelle region following the loss of Canada
Highly specialized ports: the slave trade, the salt trade, and the brandy trade
La Rochelle, a dominating port but not a regional hub
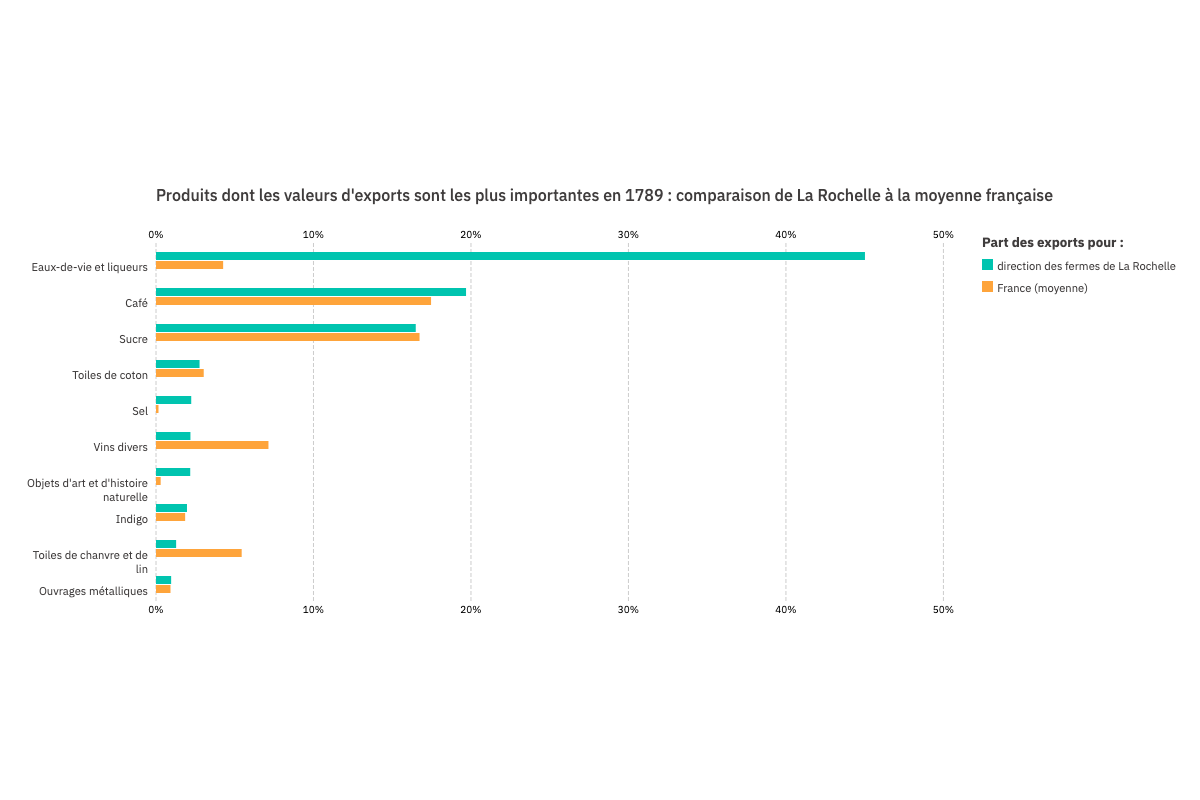
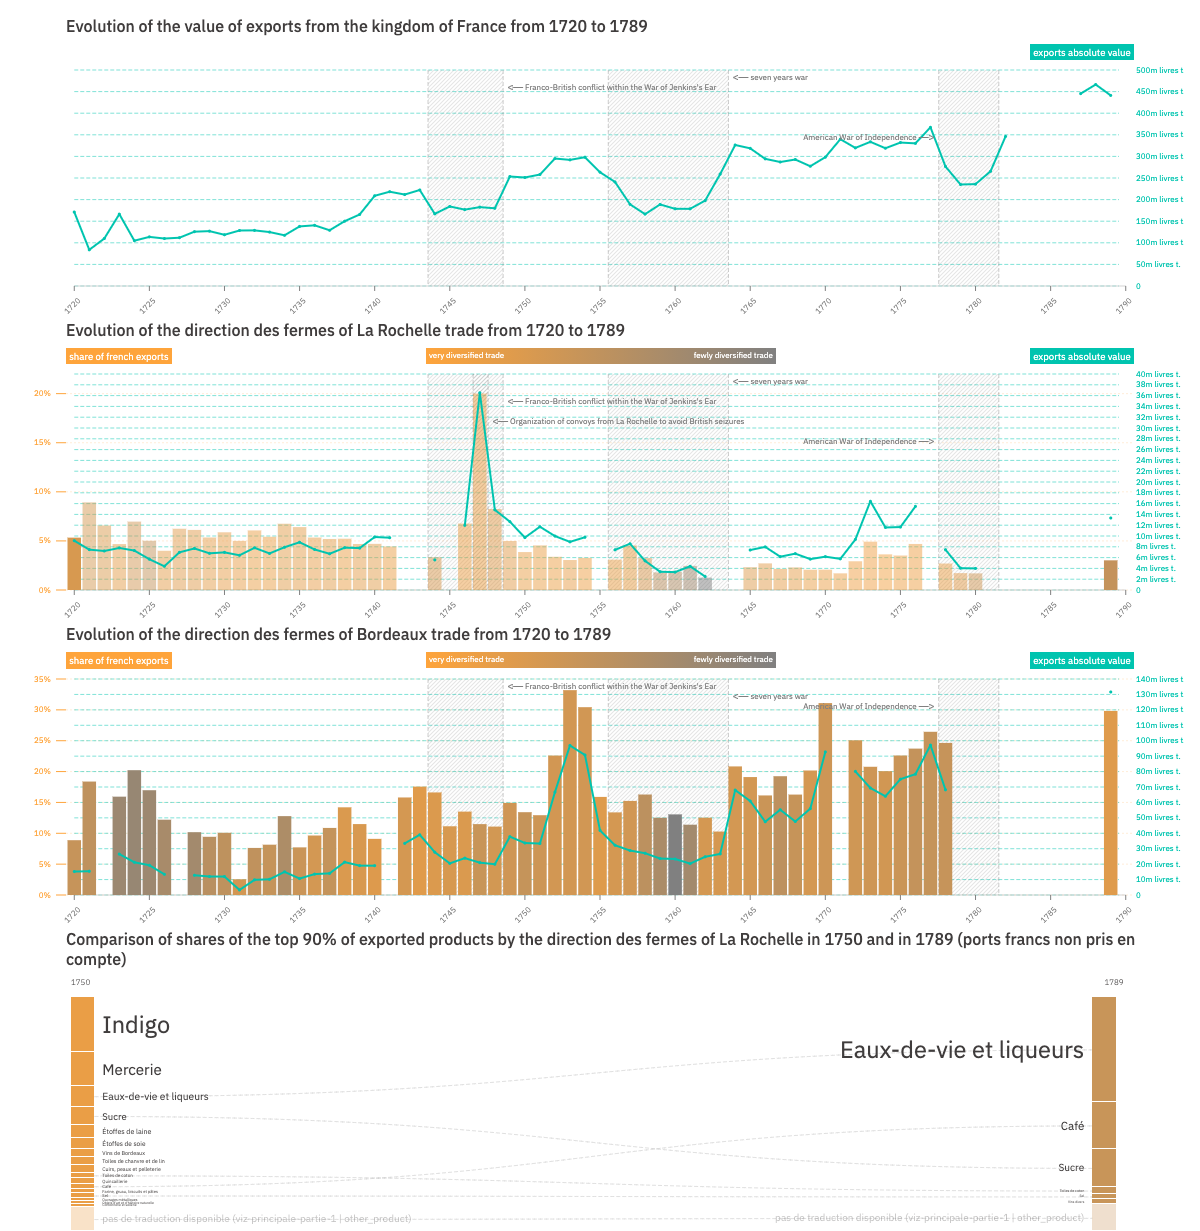
Products with the highest export value in 1789: comparison between the La Rochelle customs region and the French average
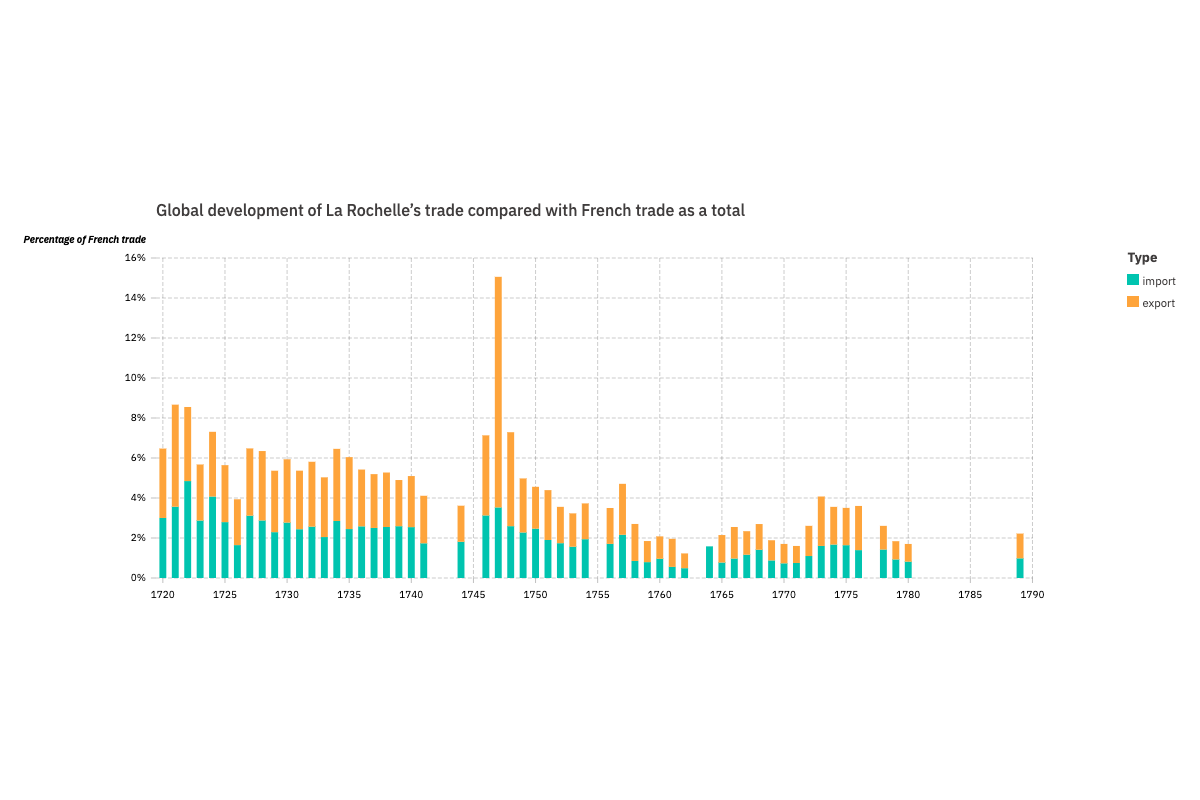
Evolution of the share of La Rochelle trade in relation to France as a whole
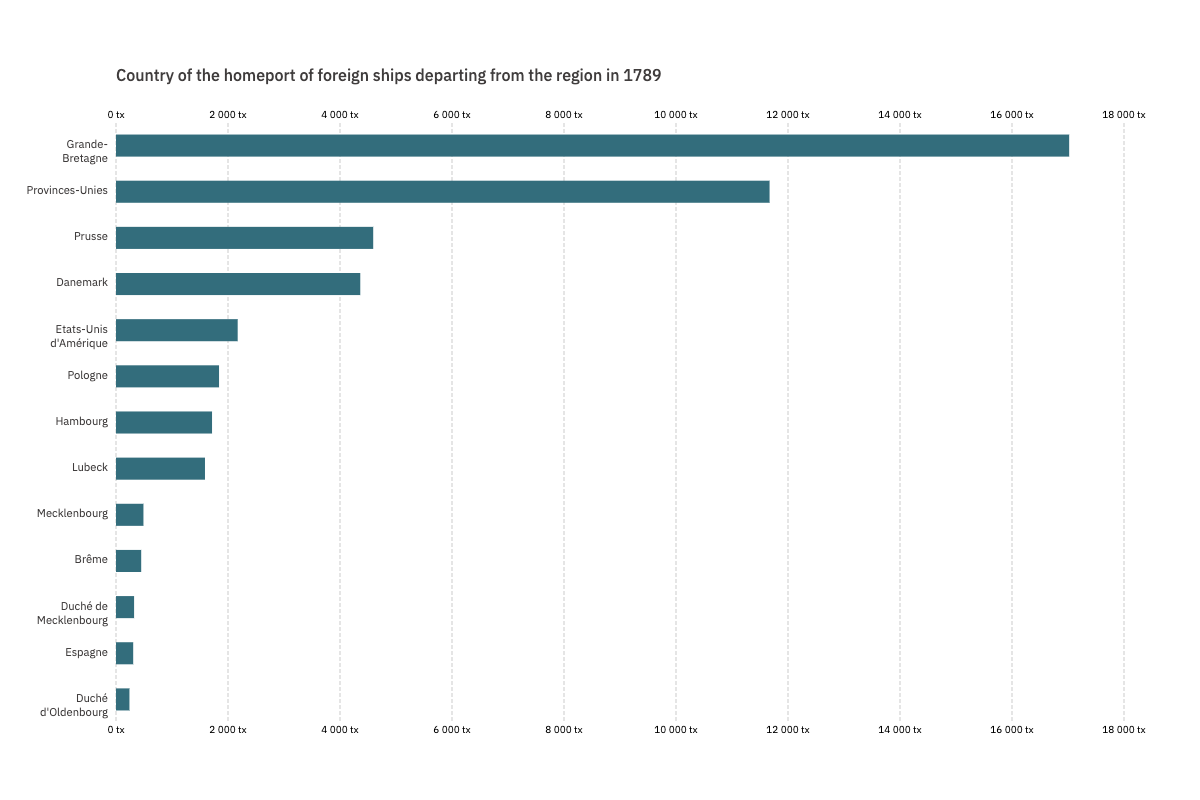
Home country of ships departing from the region in 1789
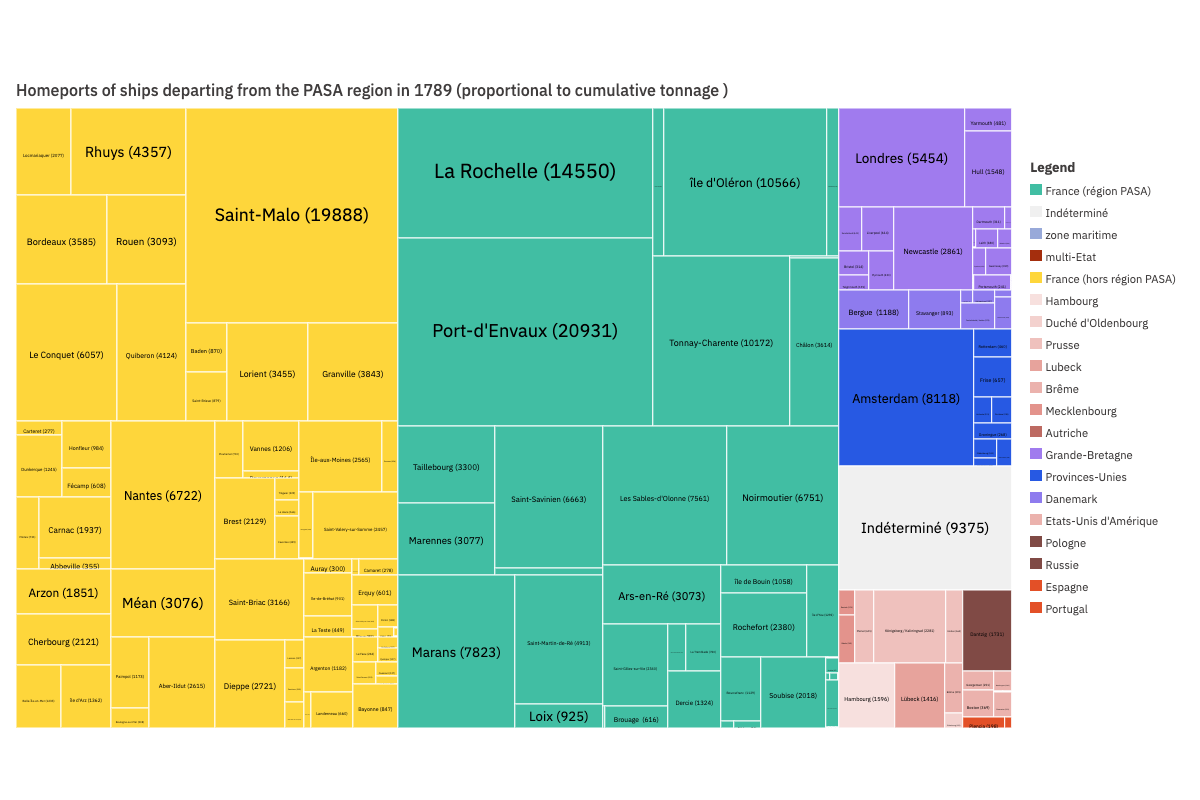
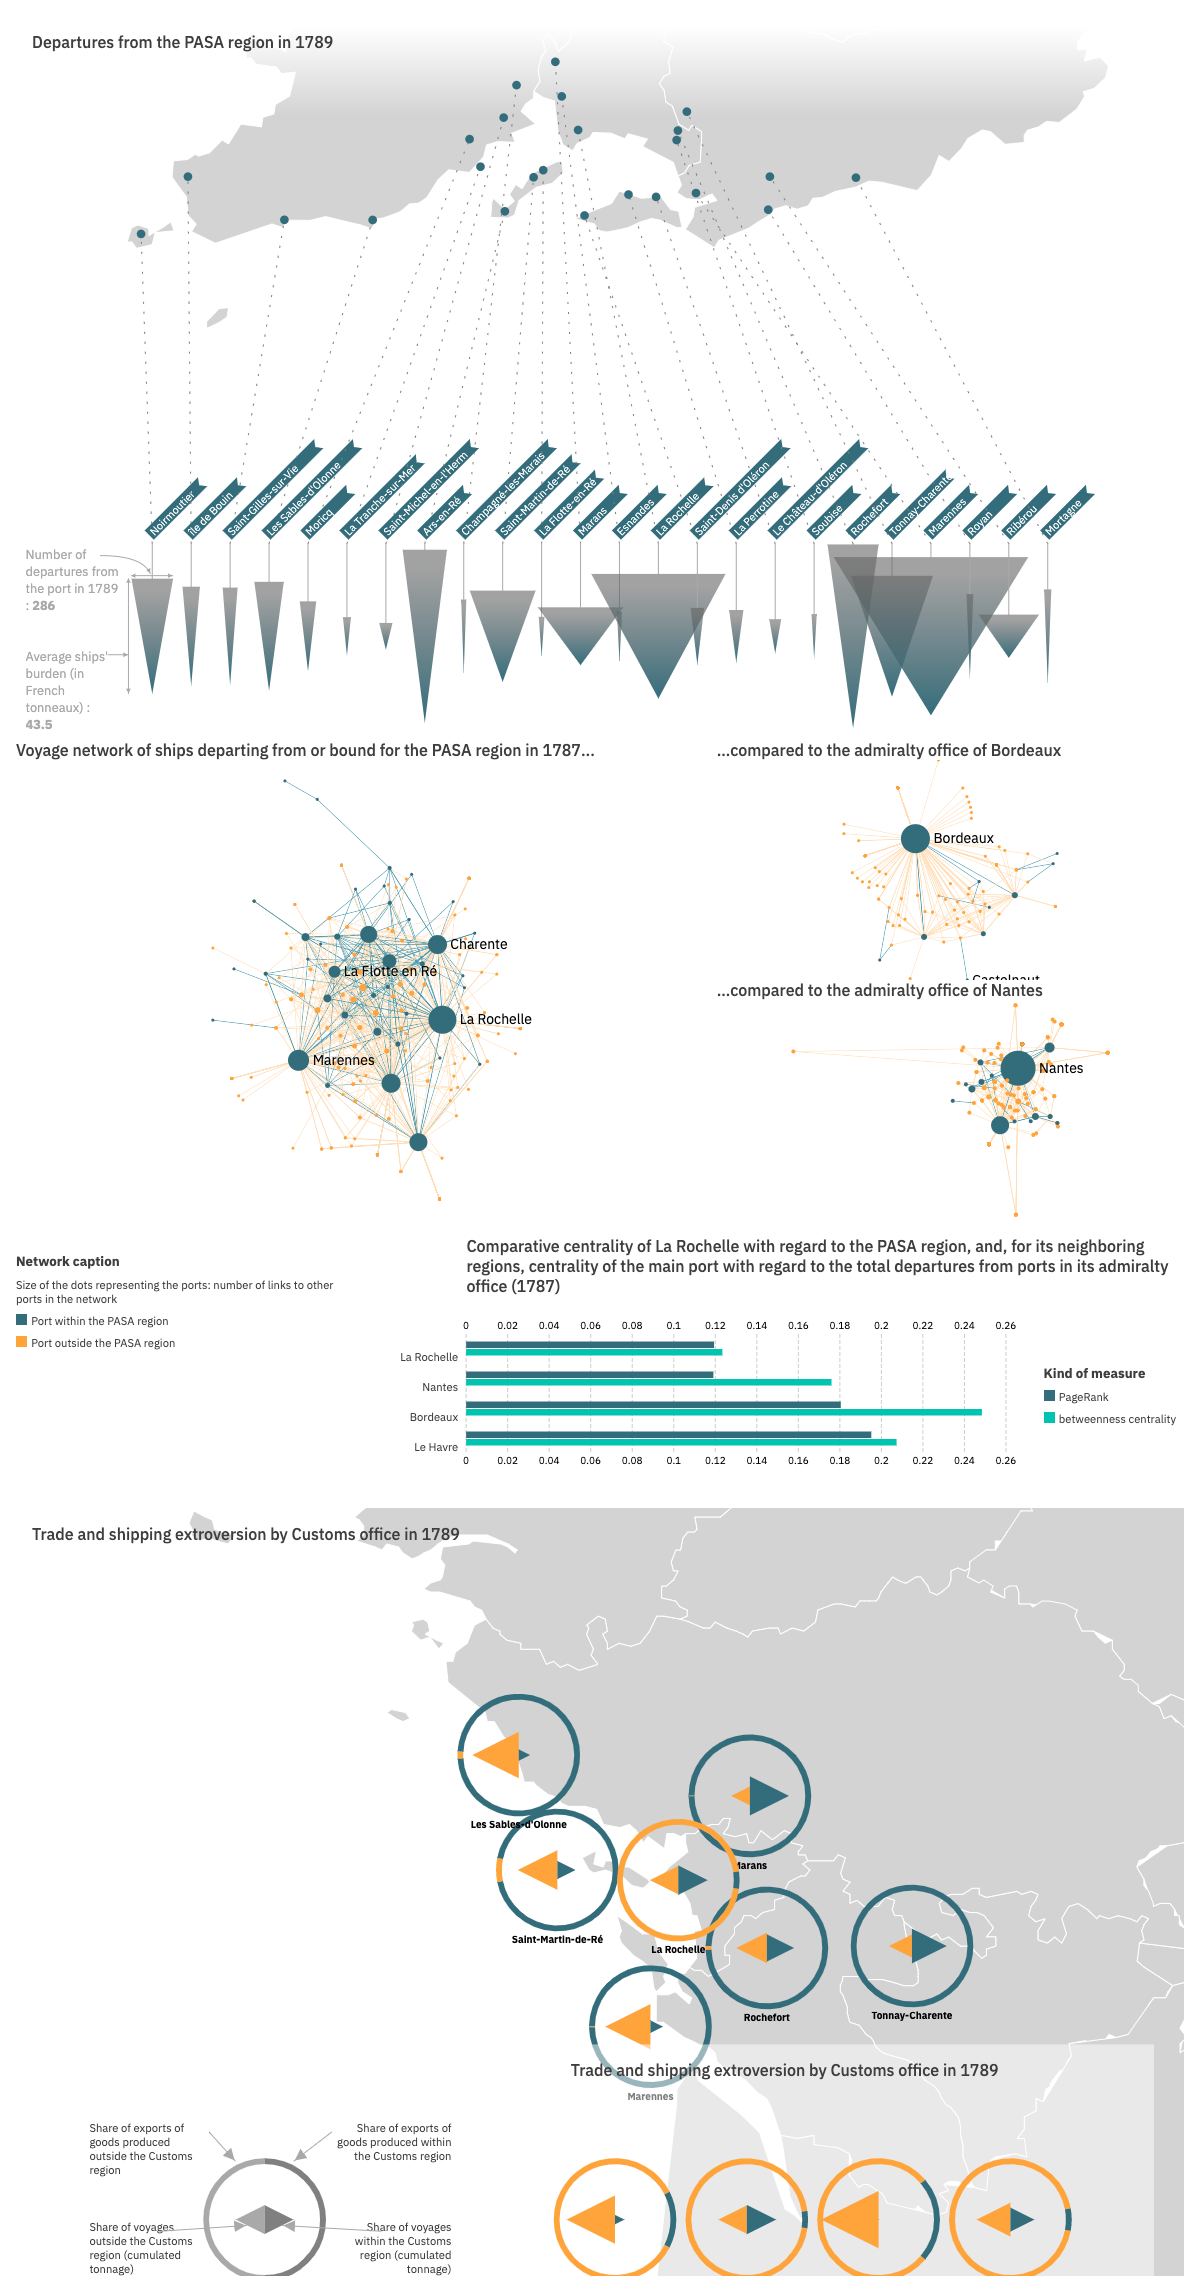
Home ports of ships departing from the PASA region in 1789
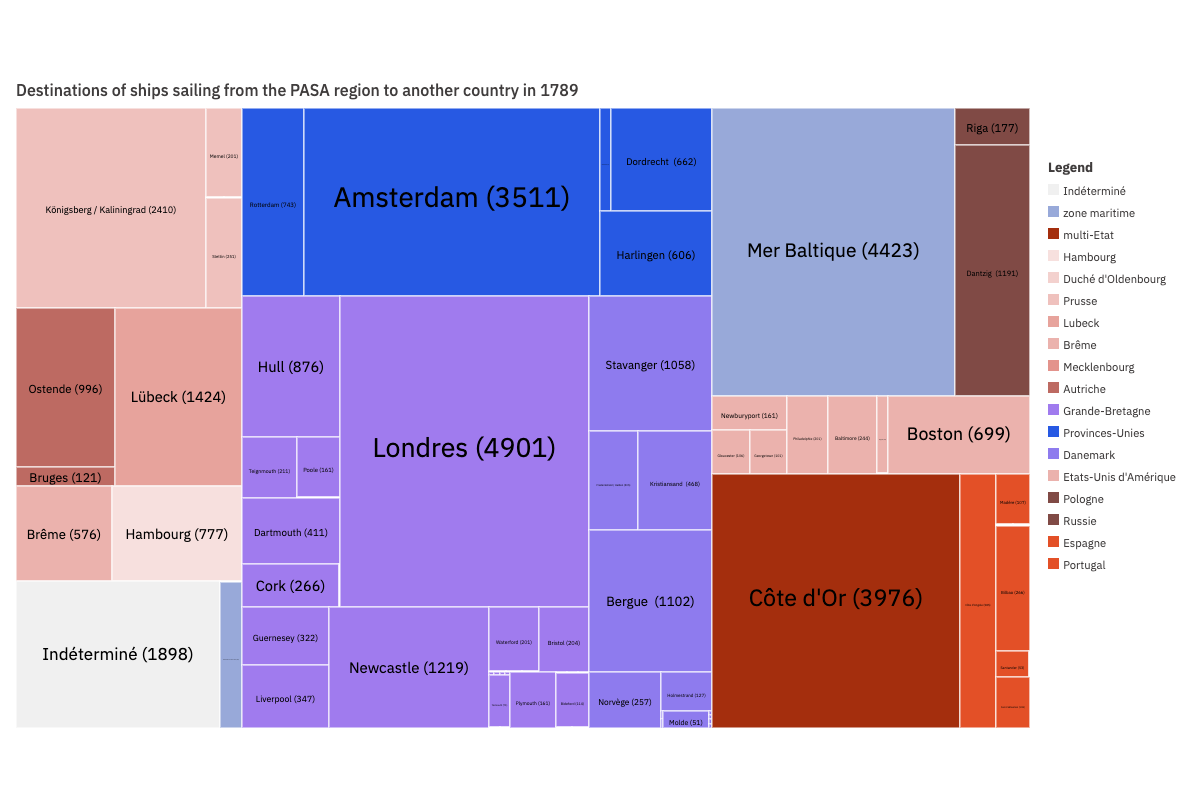
Destinations of ships sailing from the PASA region to another country in 1789
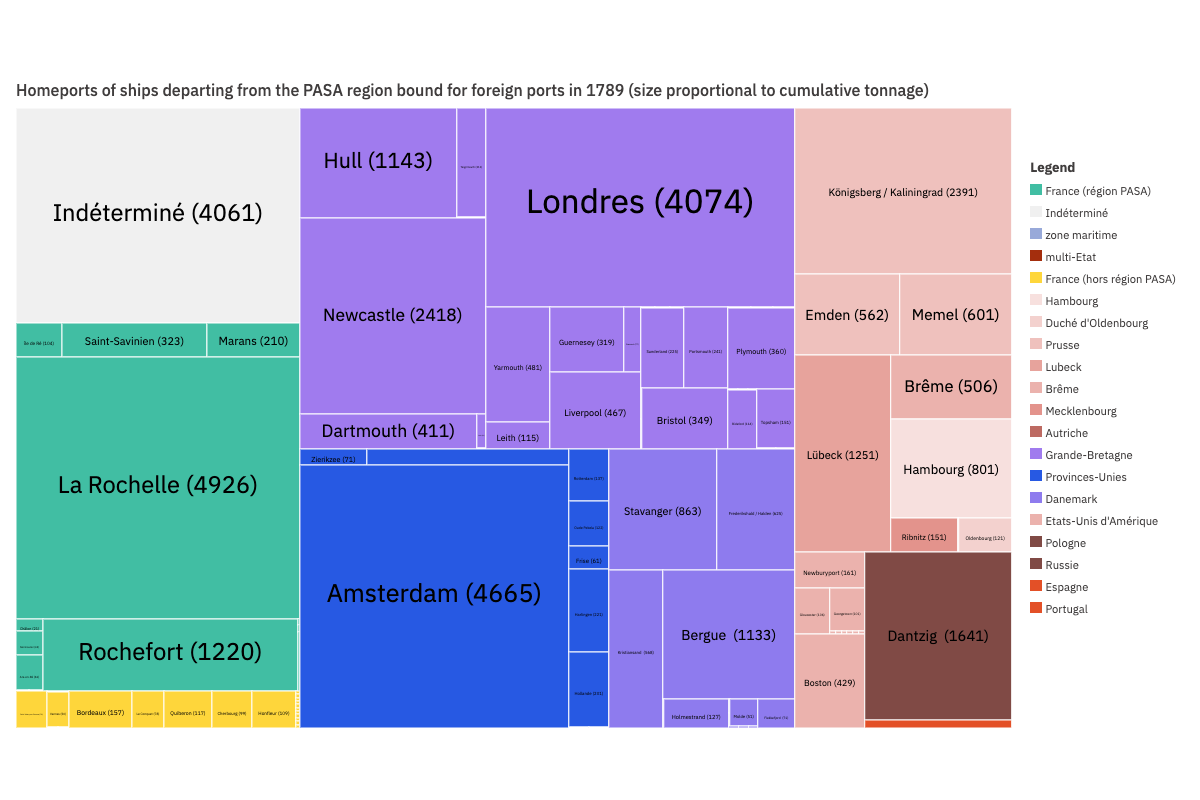
Home port of ships sailing to another country in 1789
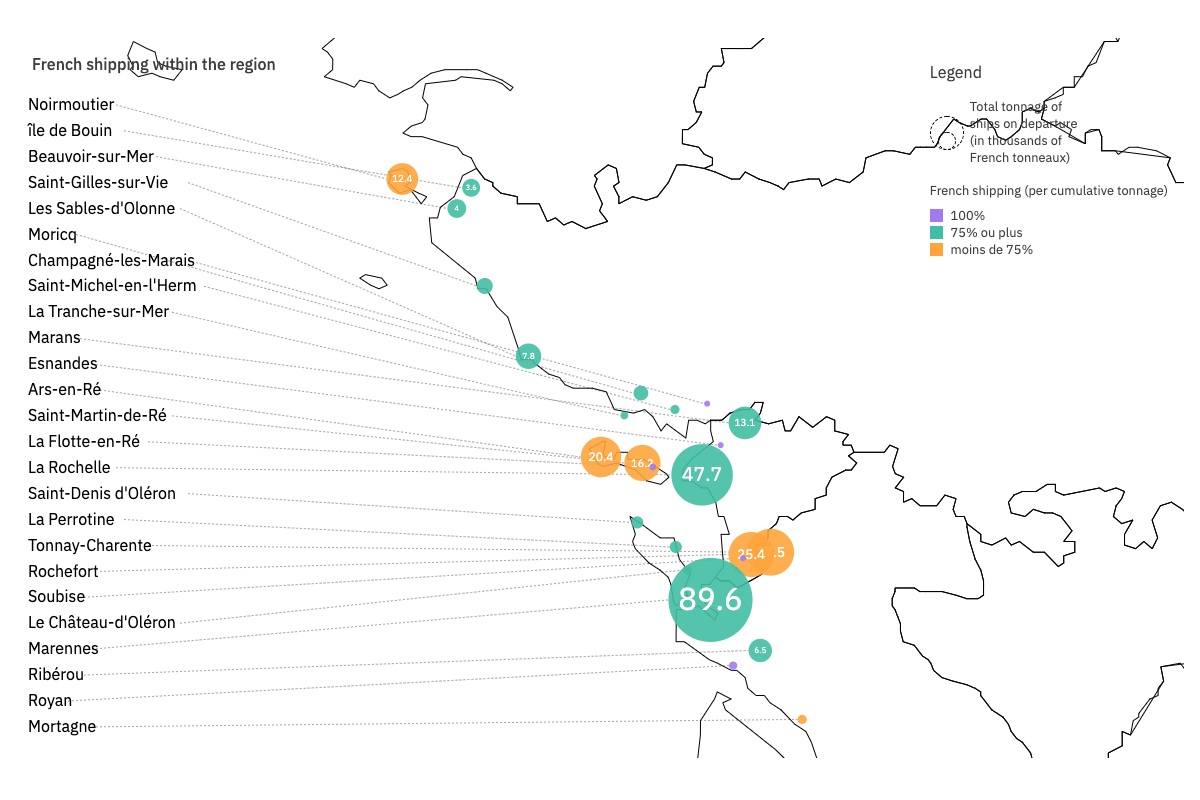
Share of French navigation in the region
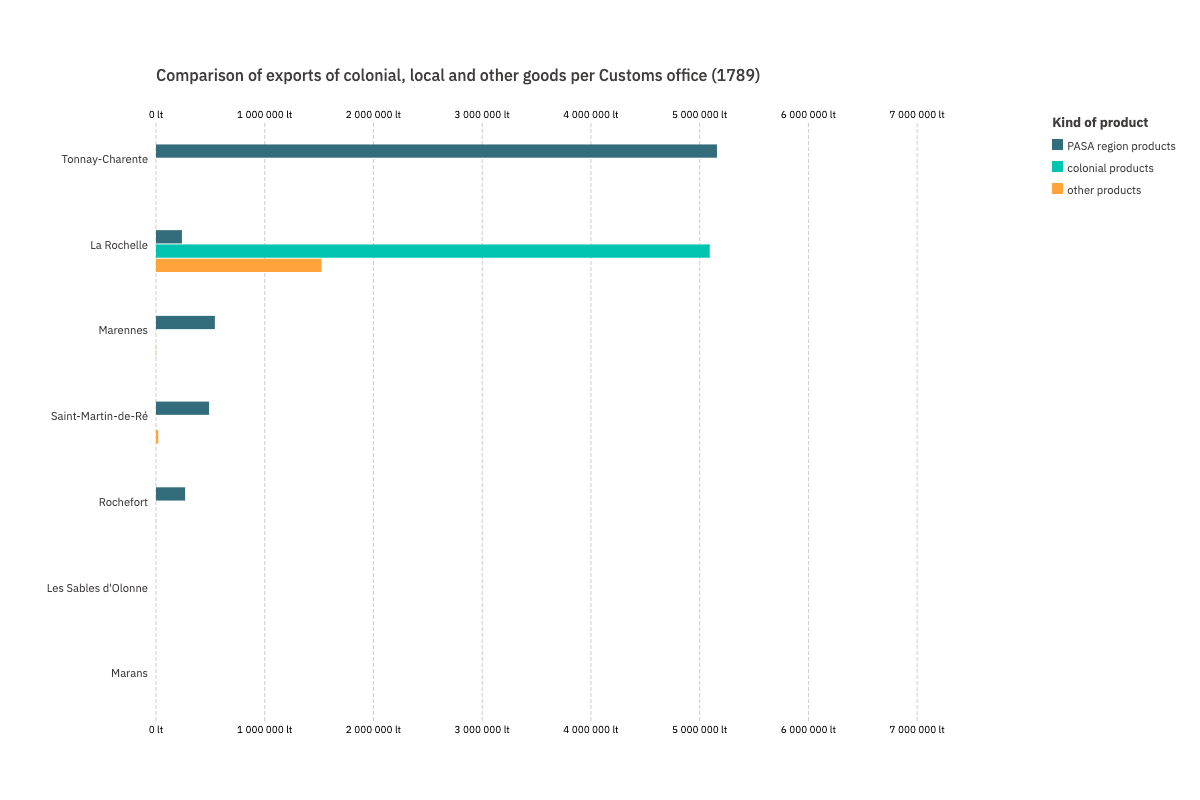
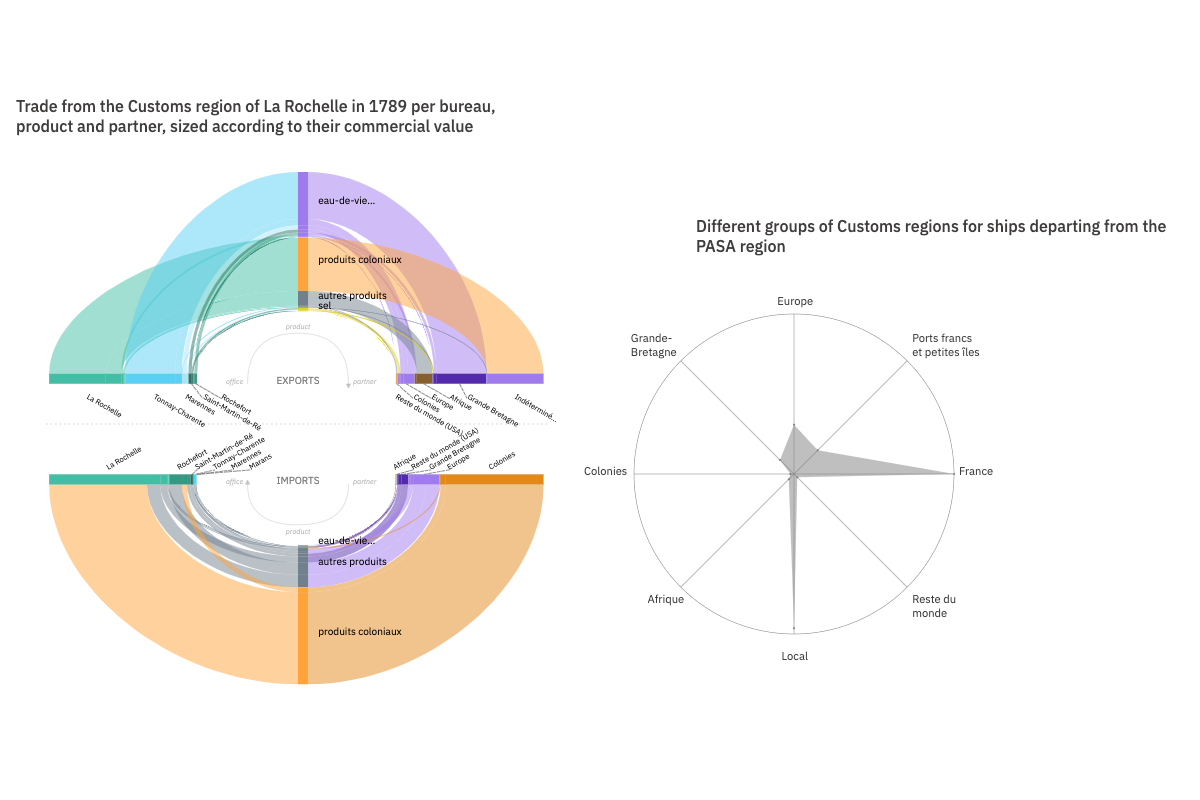
Comparison of colonial, local, and other exports by customs office
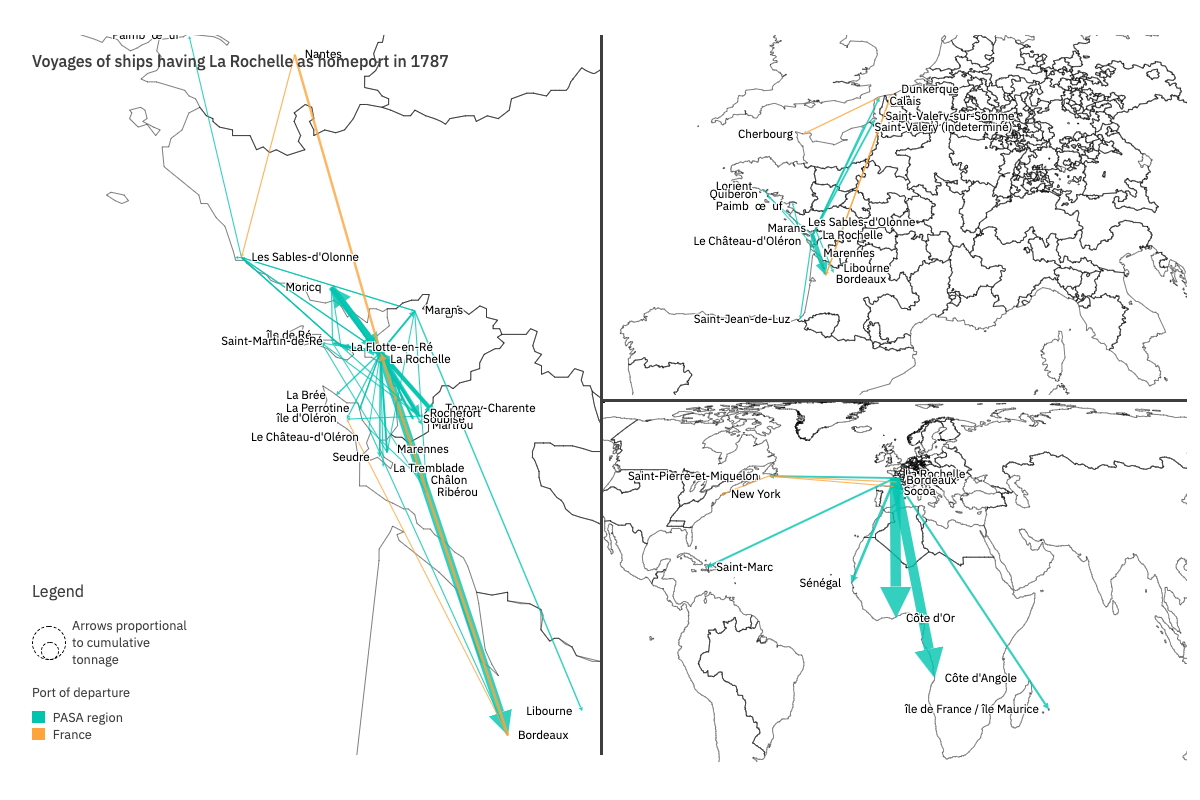
Flows of ships outfitted by the port of La Rochelle in 1787
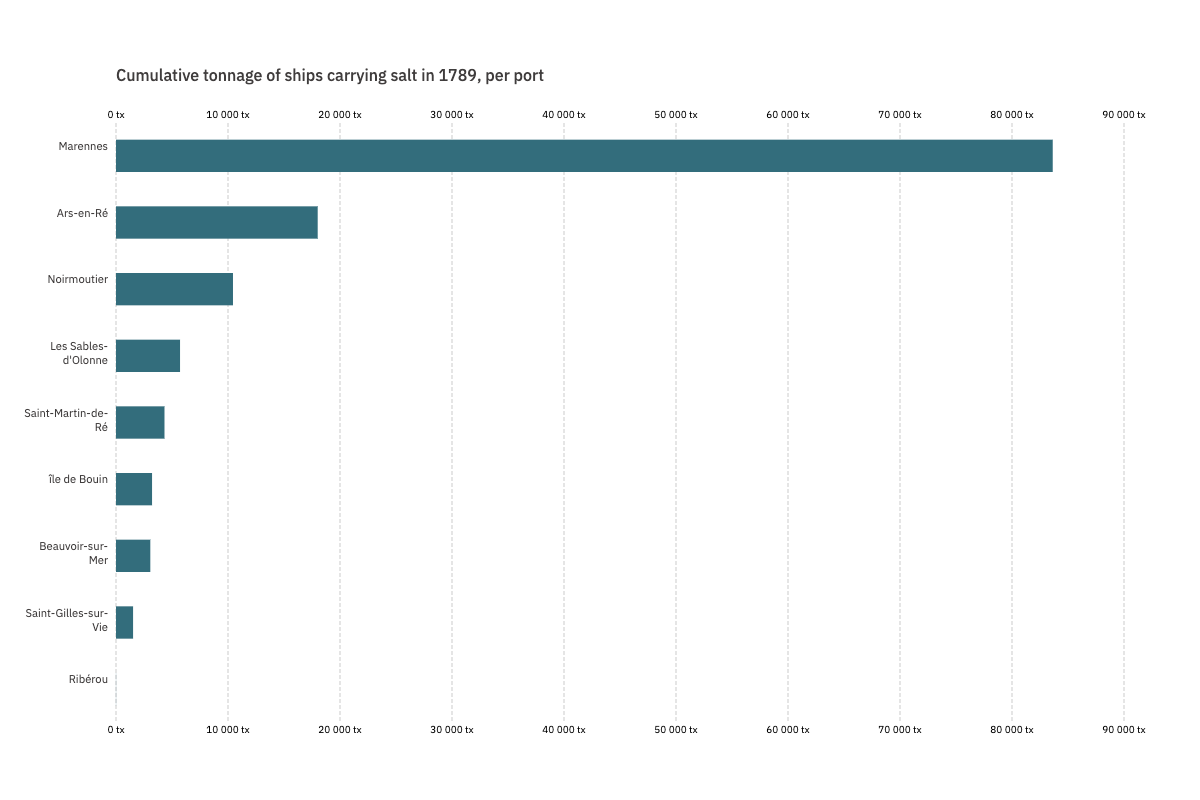
Ports of departure of vessels transporting salt in 1789 from the PASA region, aggregated by cumulative tonnage
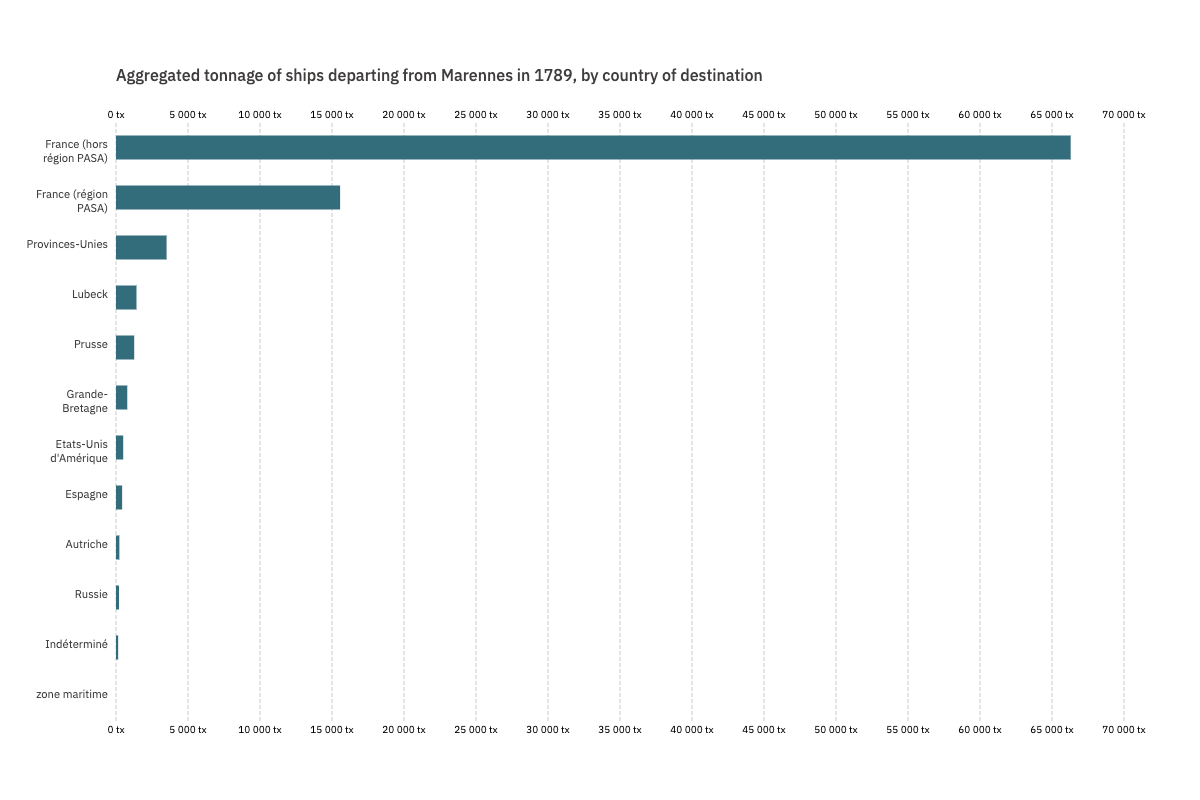
Destination of ships departing from Marennes in 1789, aggregated by country and by cumulative tonnage
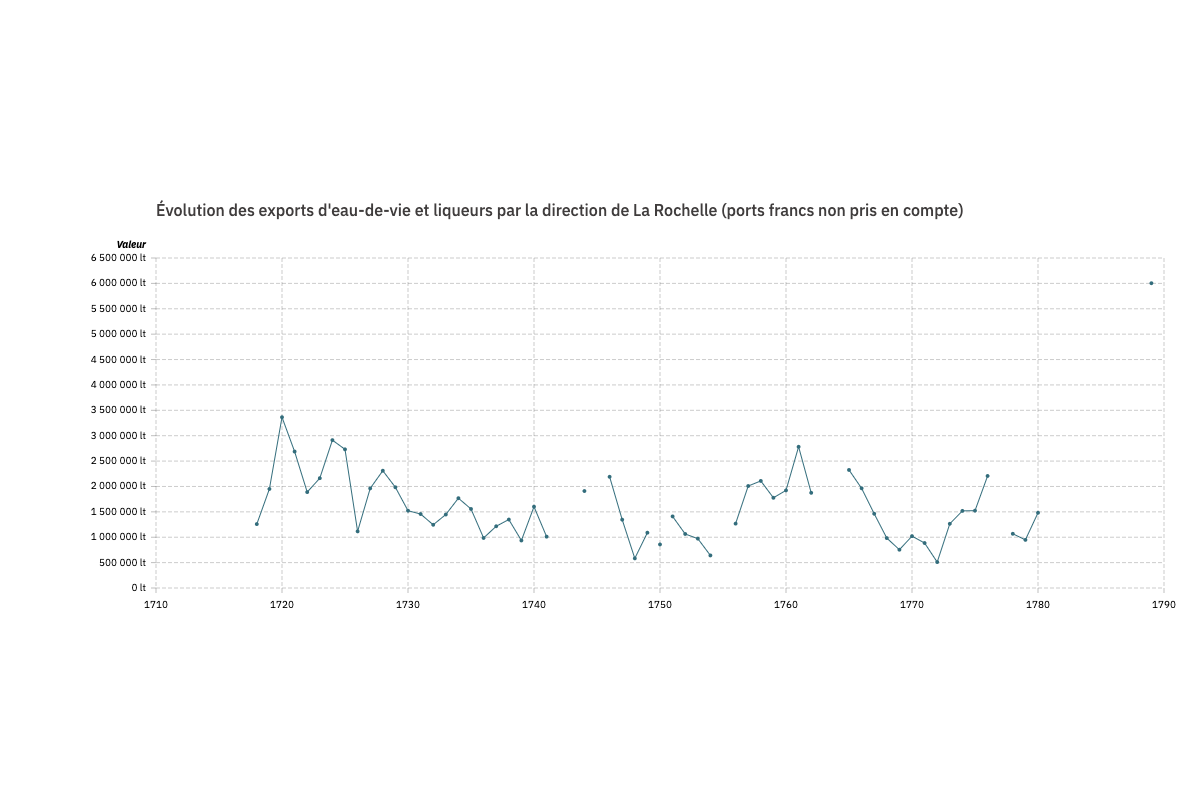
Evolution of brandy exports from the La Rochelle customs region (free ports not included)
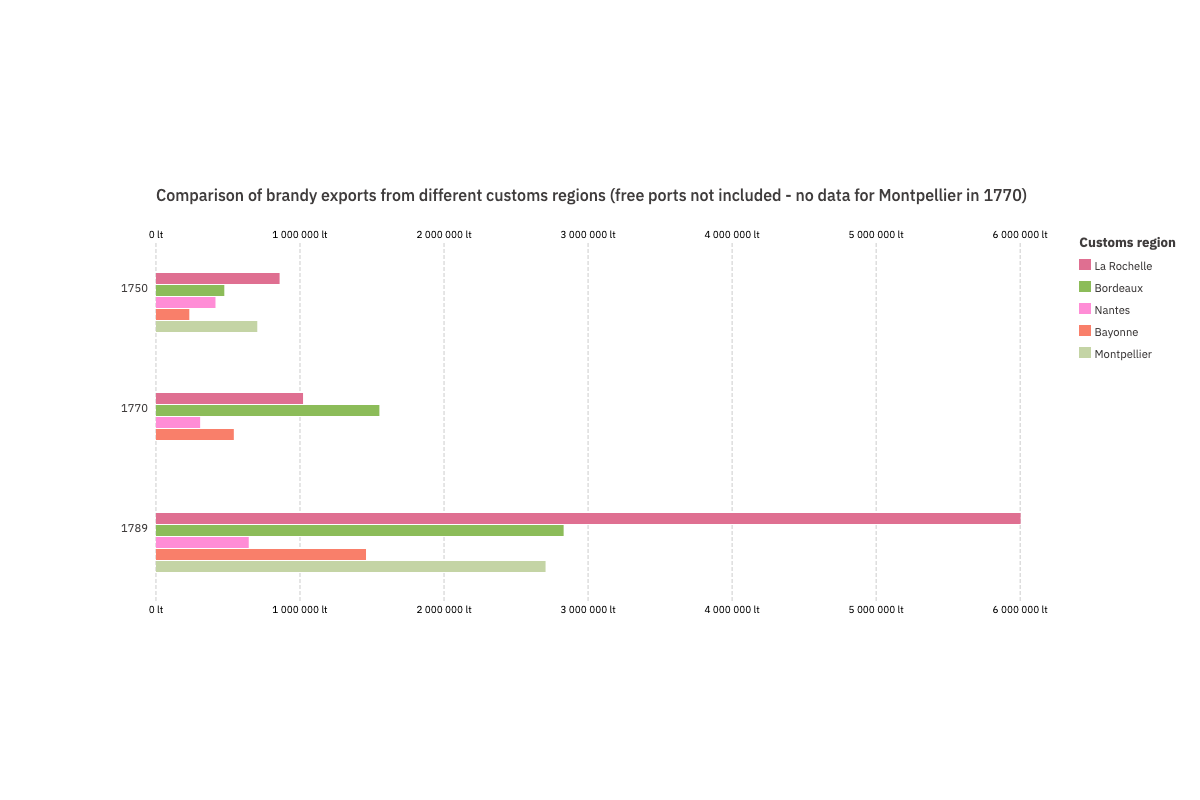
Comparison of brandy exports from different customs regions (free ports not included - no data for Montpellier in 1770)
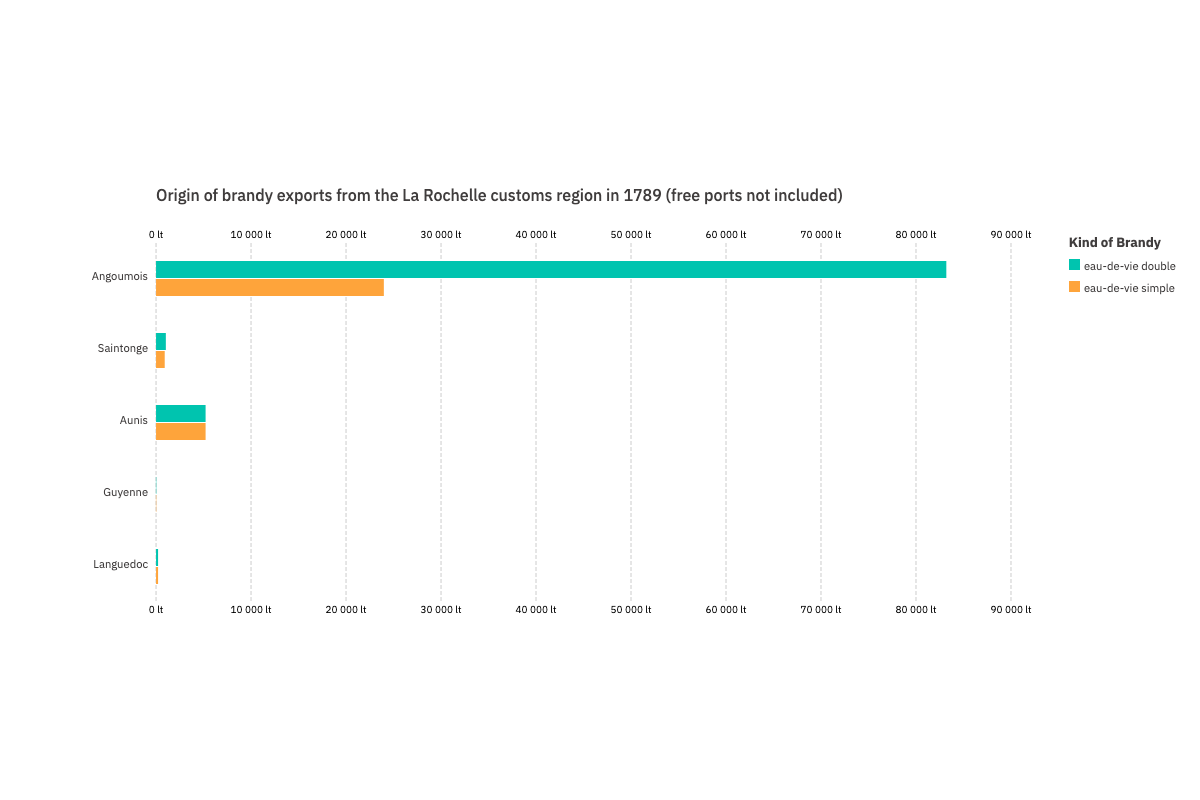
Origin of brandy exports from the La Rochelle customs region in 1789 (free ports not included)
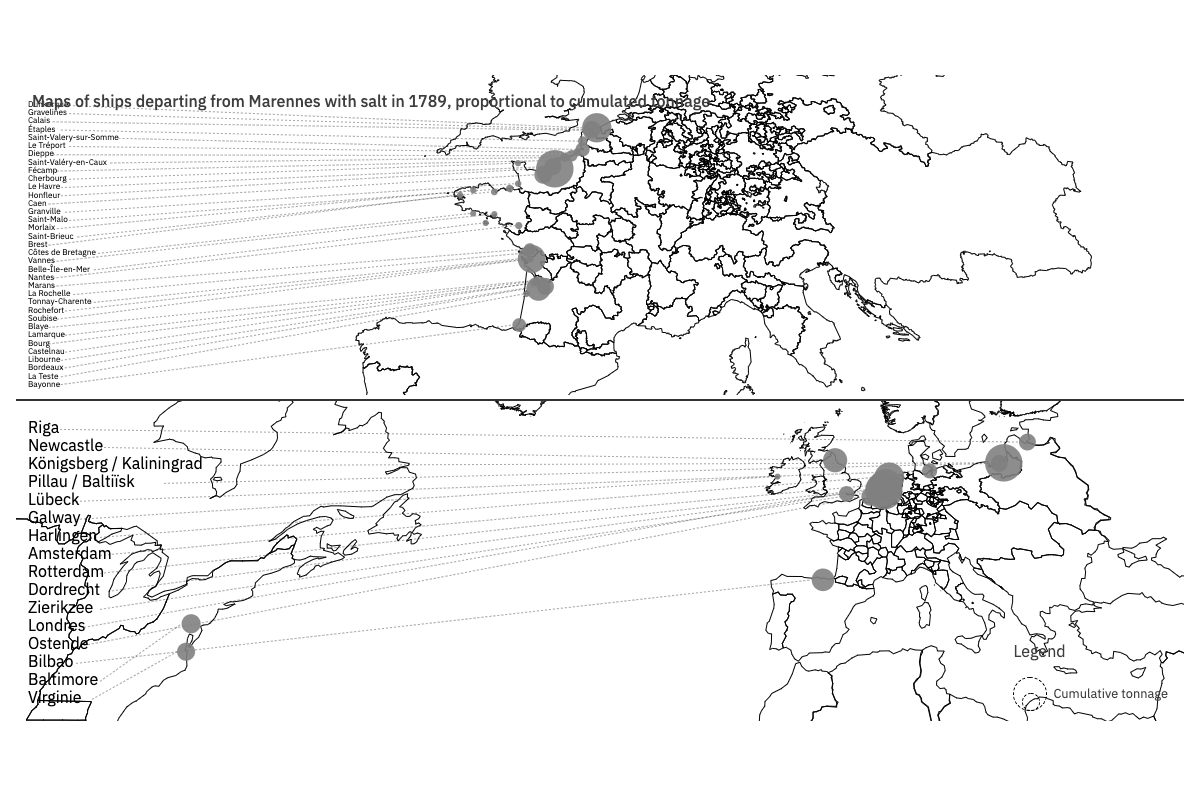
Maps of ships leaving Marennes with salt in 1789, sized by cumulative tonnage
Evolution of the share of La Rochelle trade in relation to France as a whole
How were the data and visualization produced ?
Data for this chart was drawn from the Toflit18 database. Calculations of national flows were based on national records (sources: "Best Guess National partner") and flows from La Rochelle were based on local records (sources: "Best Guess region prod x part"). Free ports were excluded from the calculations.
How to read the visualization?
This chart shows the percentage of exports (in orange) and imports (in blue-green) of the La Rochelle customs region in relation to France's total exports and imports. Specific data can be seen by hovering over the bars for each year. The chart as a whole shows a gradual decline during the eighteenth century, despite an exceptional peak due to the expeditions under convoy in 1747.
Loading visualization