Visualizations atlas
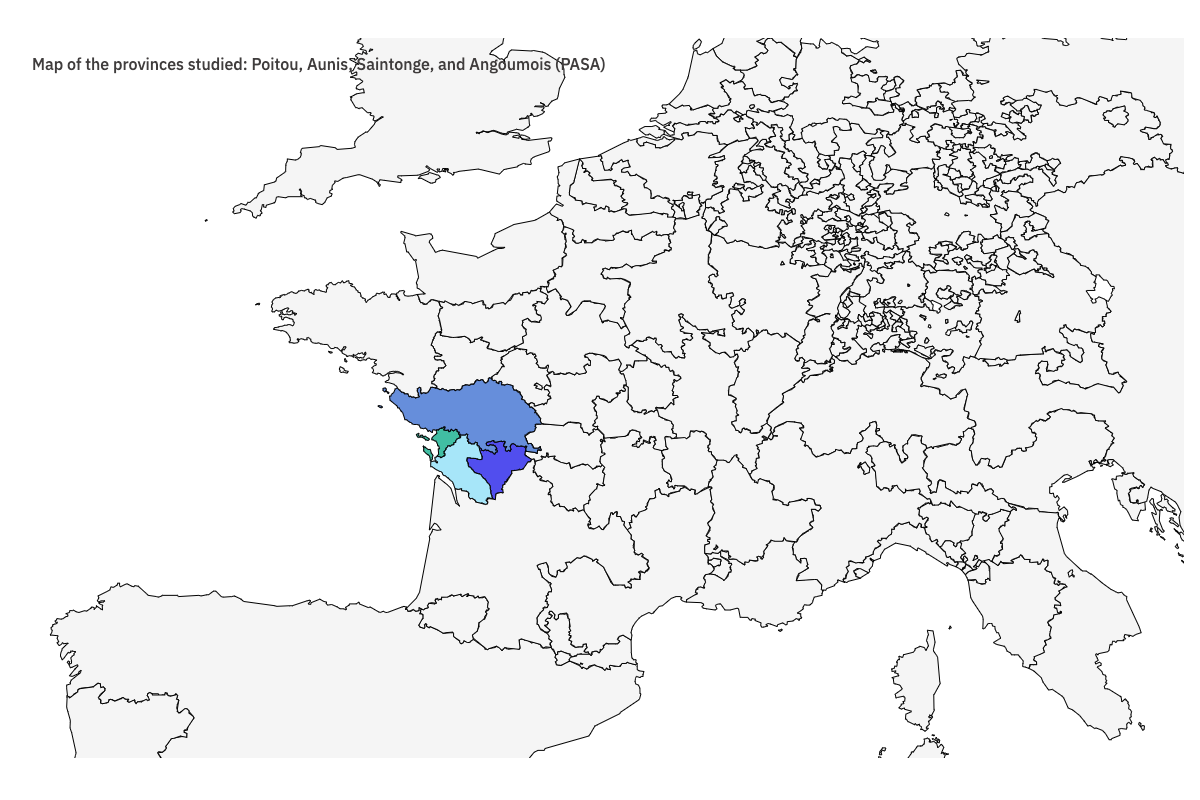
Map of the provinces investigated : Poitou, Aunis, Saintonge, Angoumois (PASA)
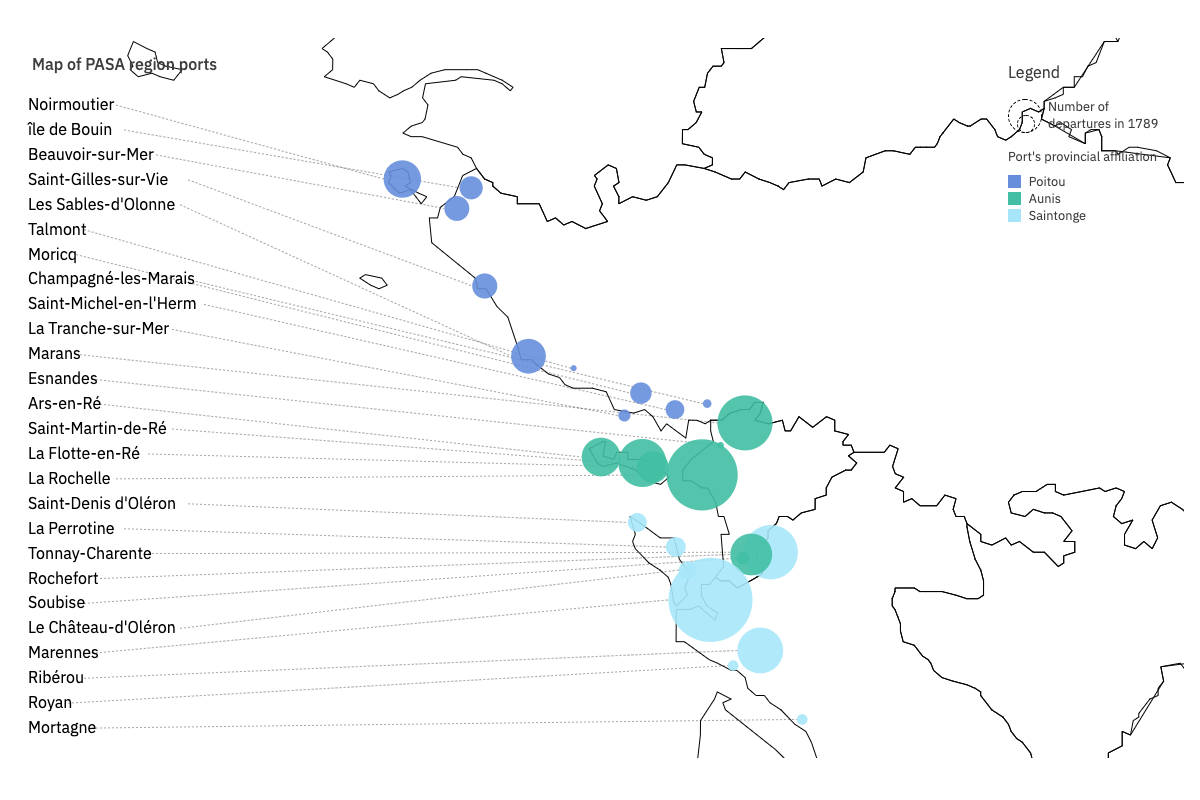
Map of PASA region ports
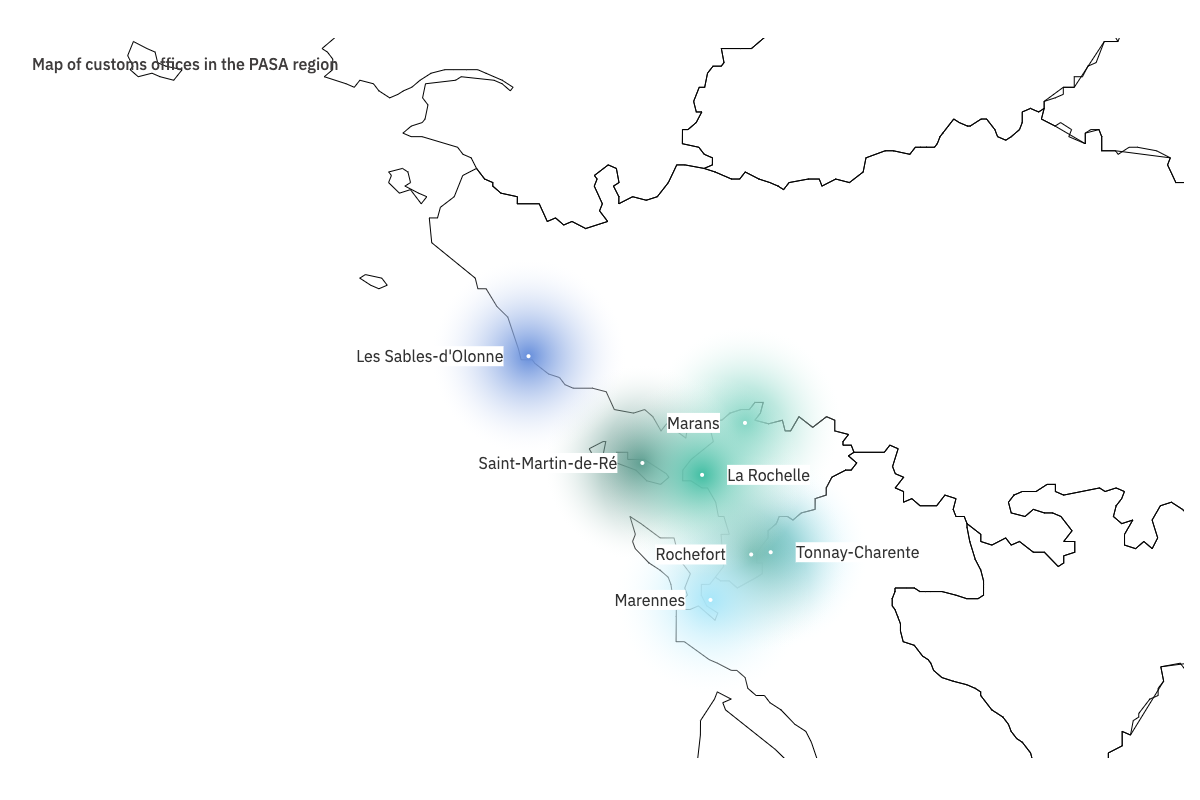
Map of customs offices in the PASA region
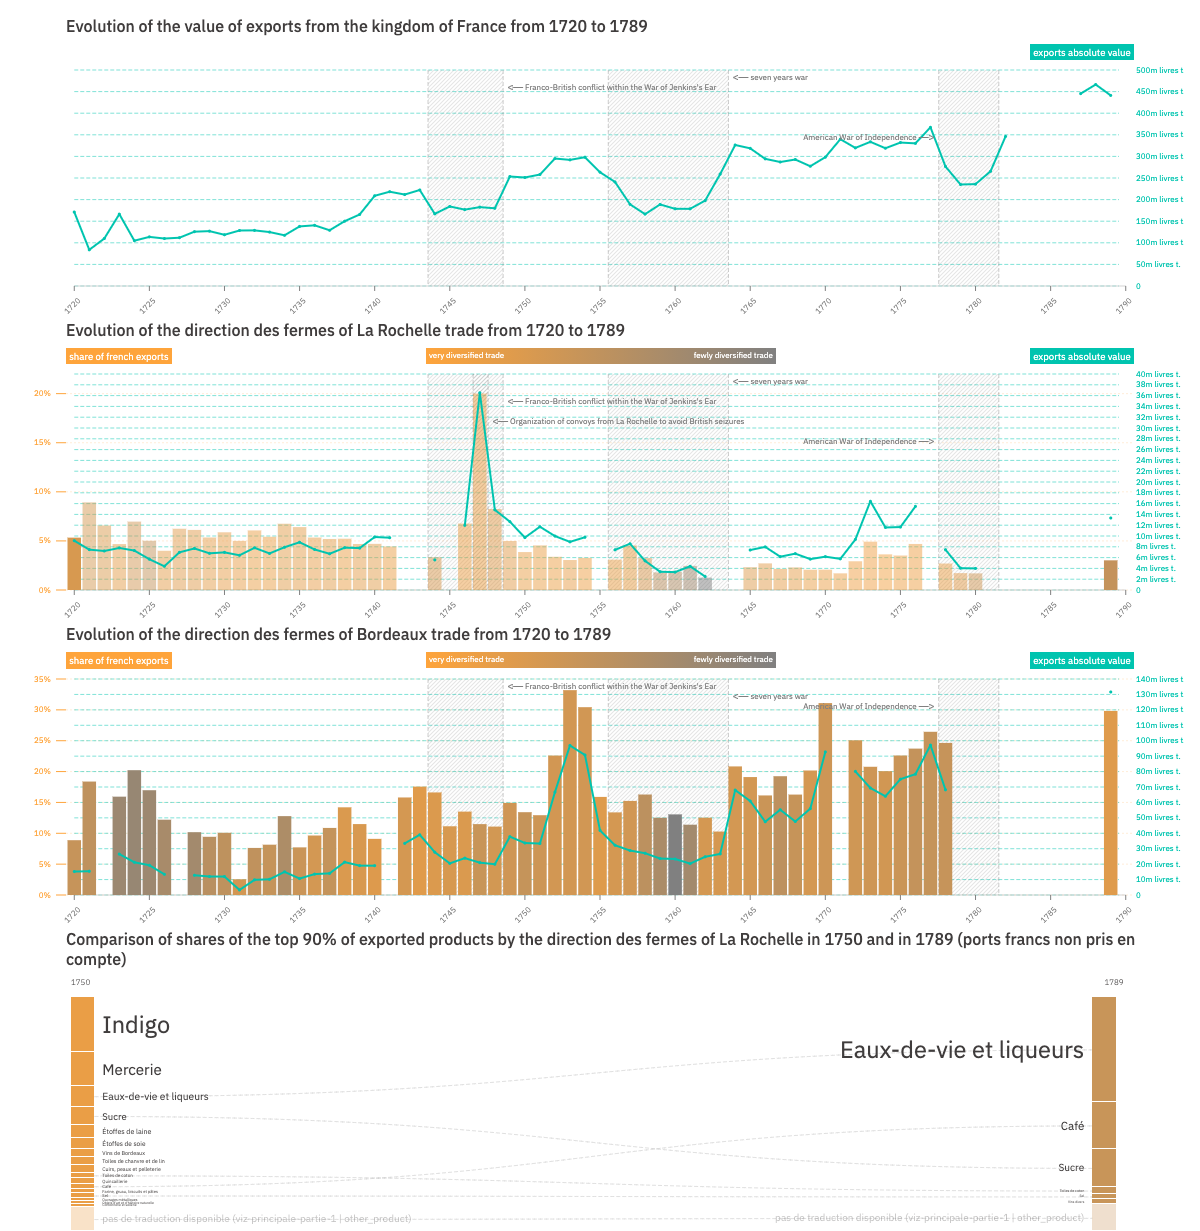
The decline of the La Rochelle region following the loss of Canada
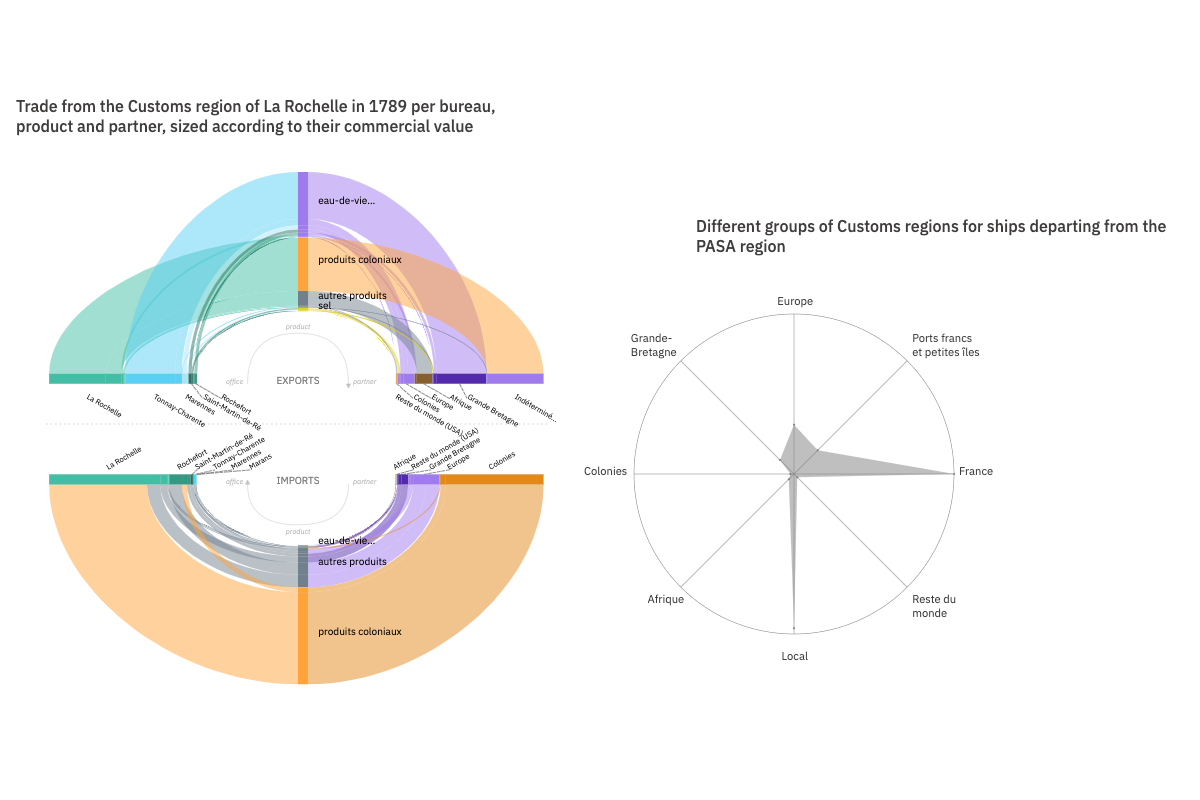
Highly specialized ports: the slave trade, the salt trade, and the brandy trade
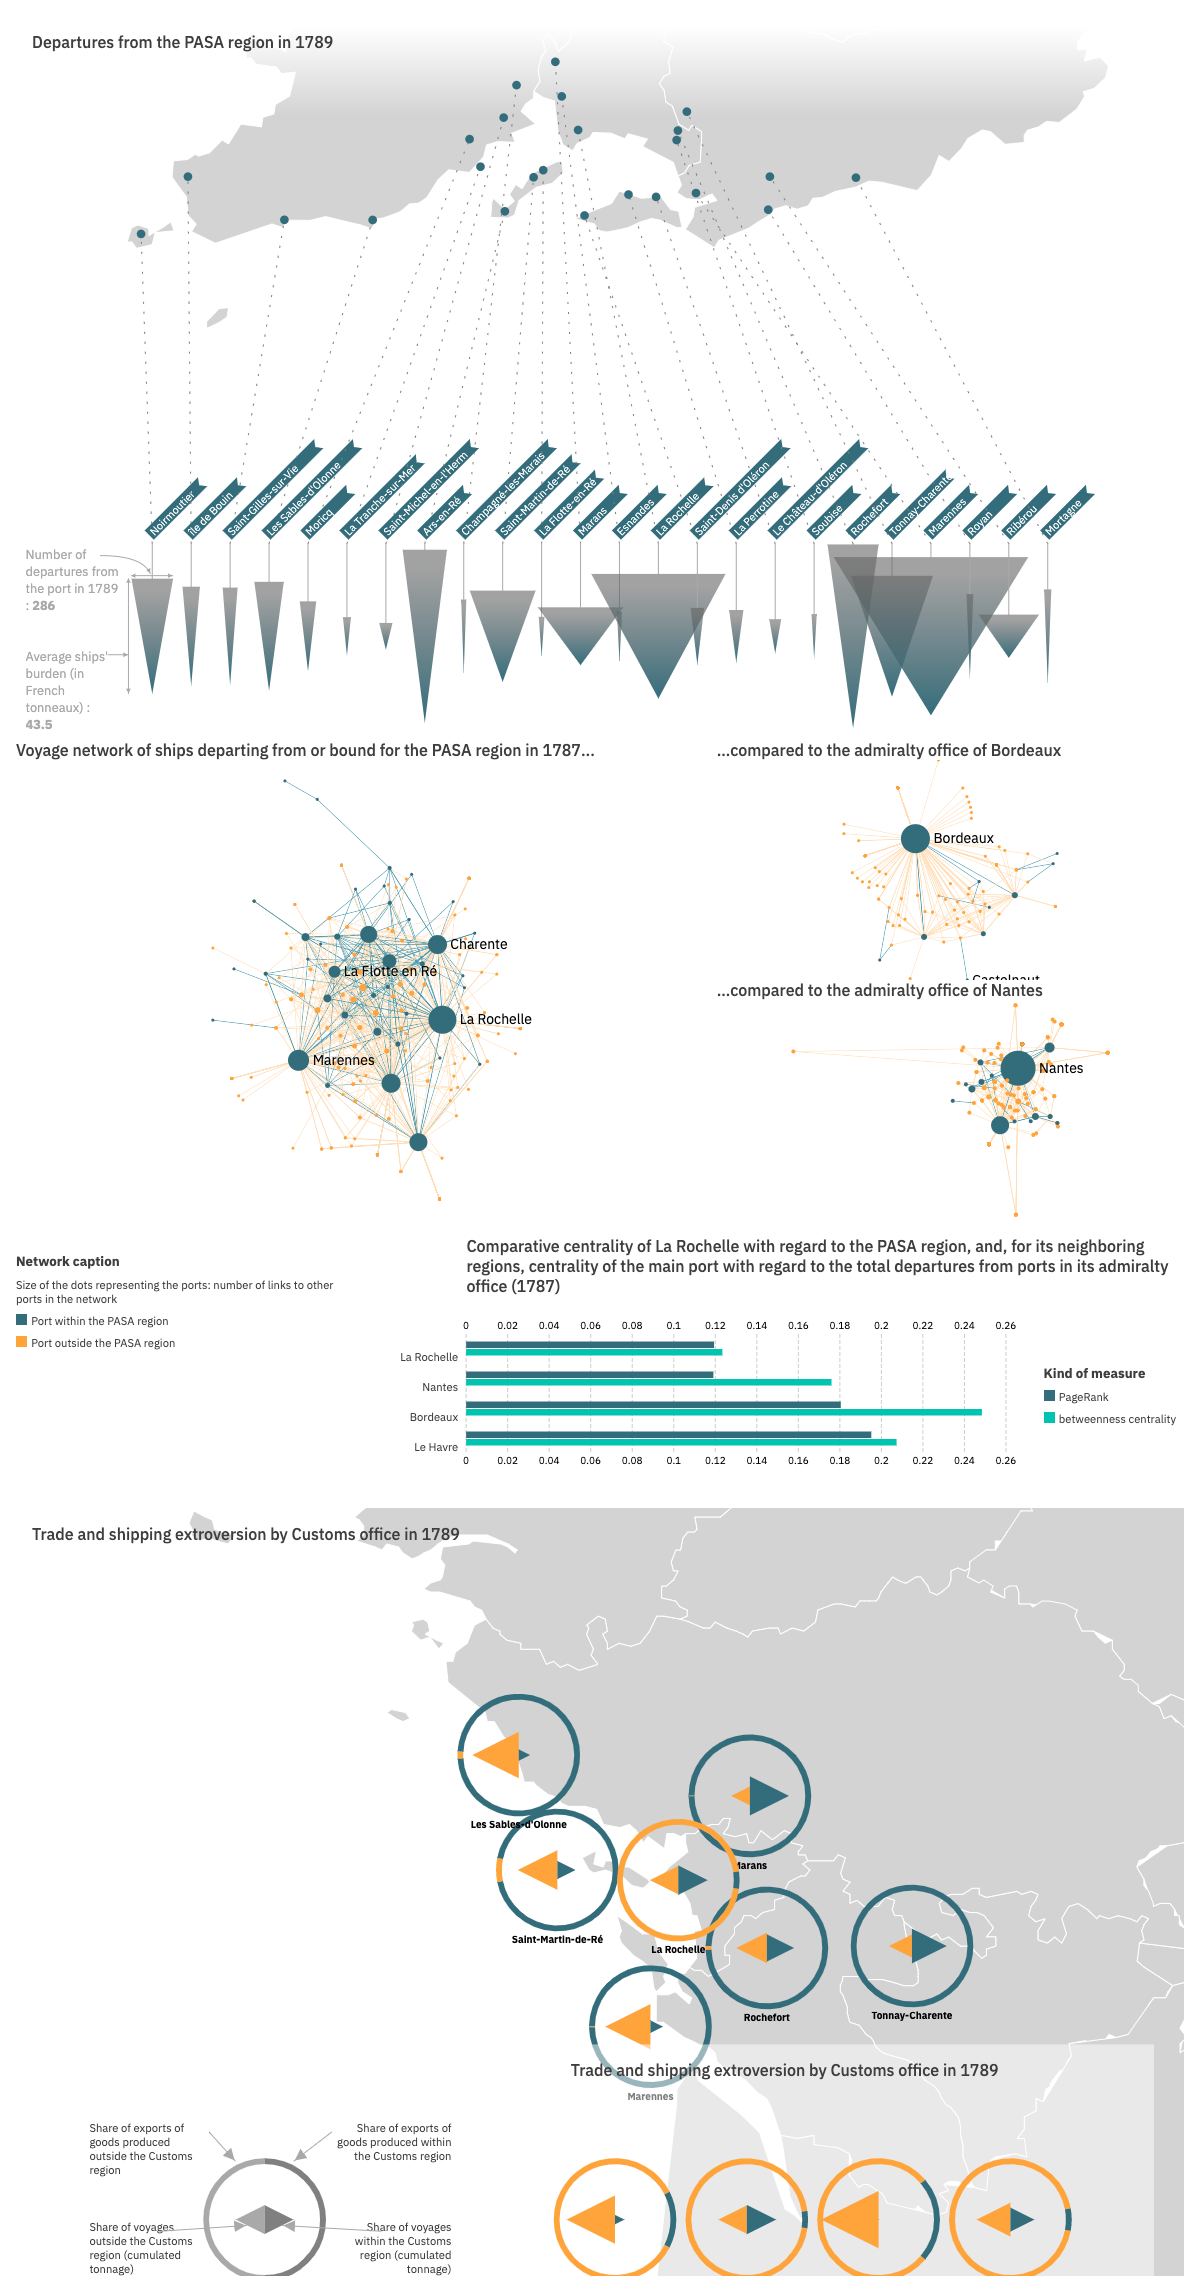
La Rochelle, a dominating port but not a regional hub
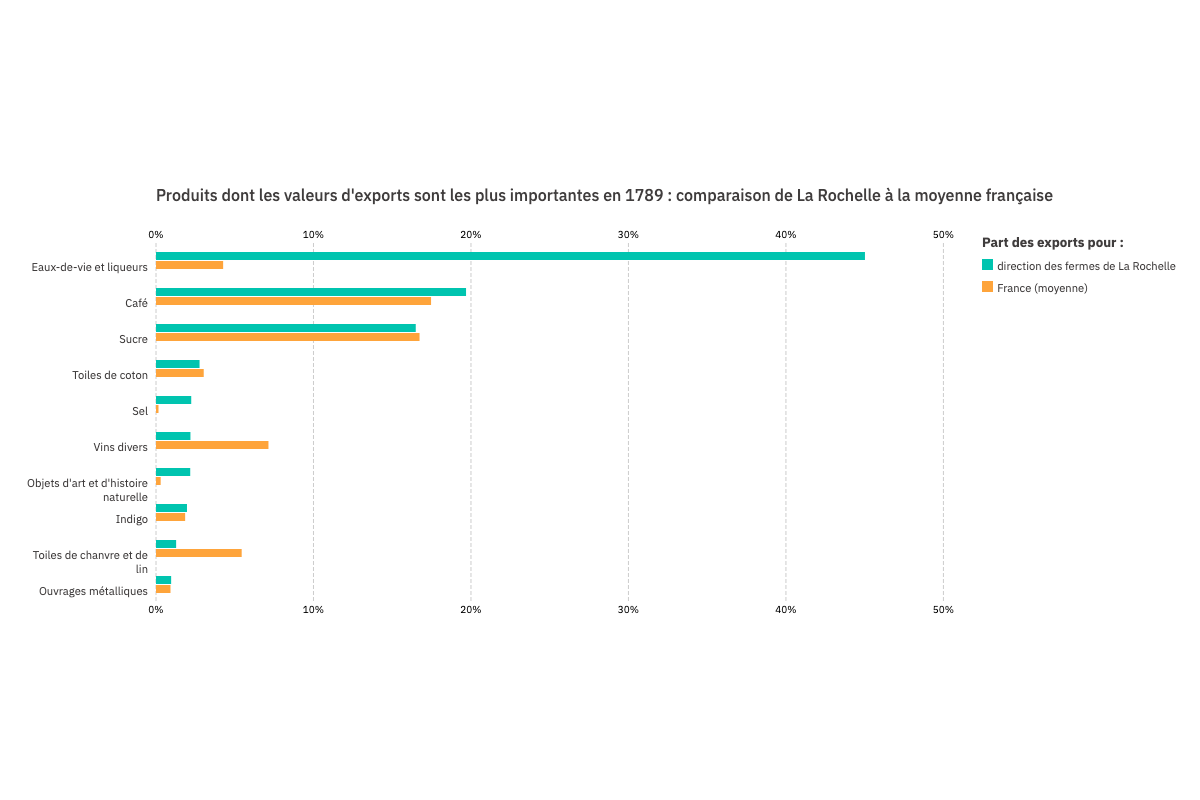
Products with the highest export value in 1789: comparison between the La Rochelle customs region and the French average
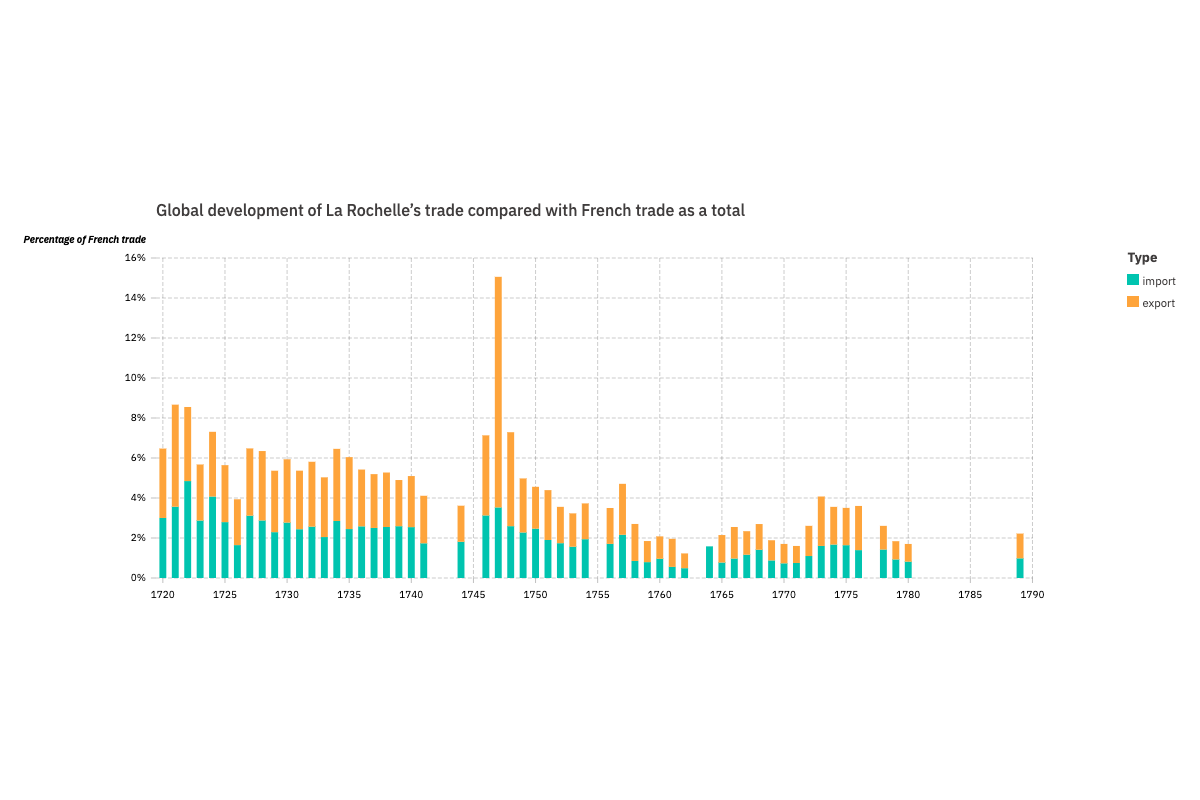
Evolution of the share of La Rochelle trade in relation to France as a whole
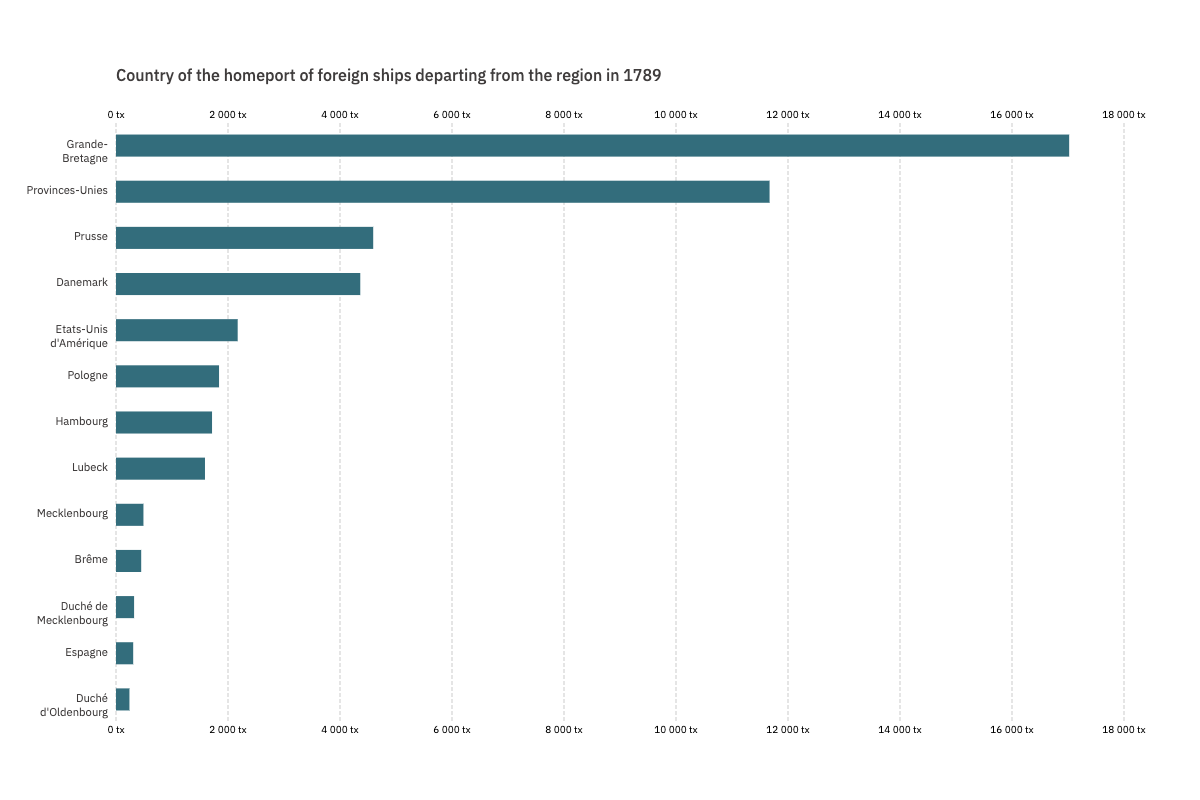
Home country of ships departing from the region in 1789
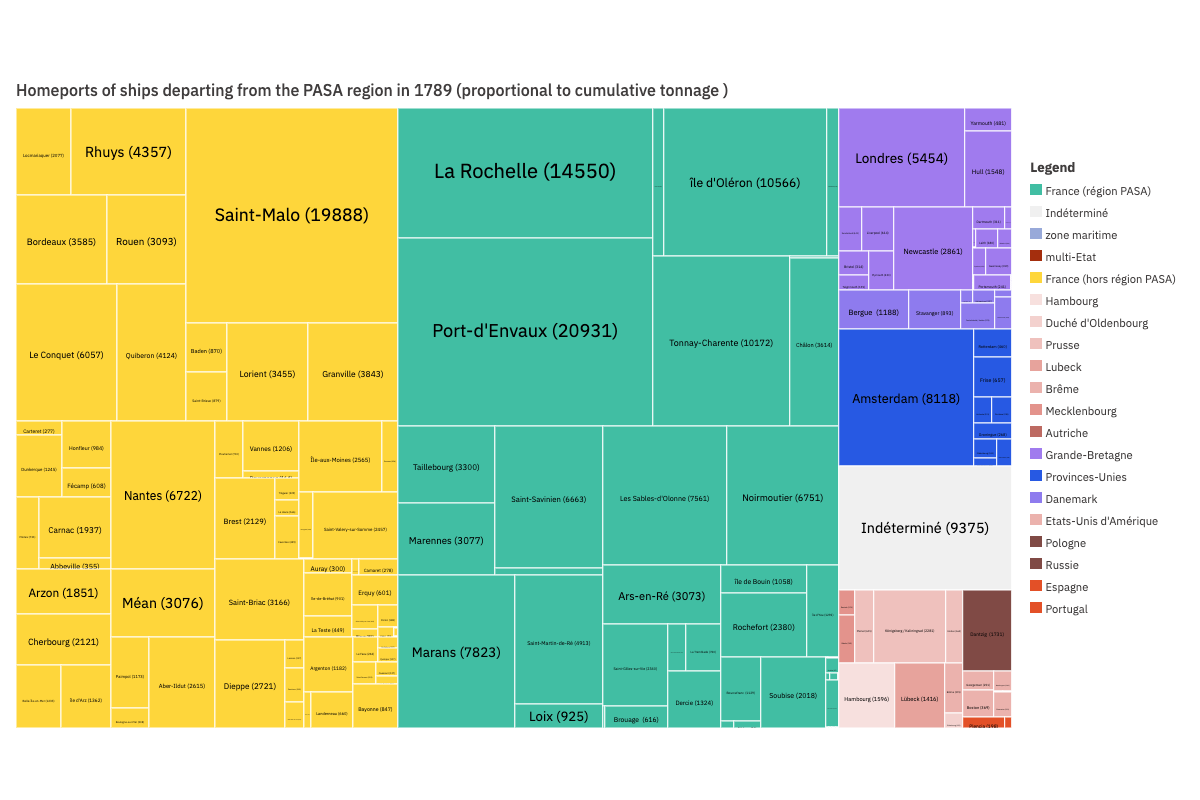
Home ports of ships departing from the PASA region in 1789
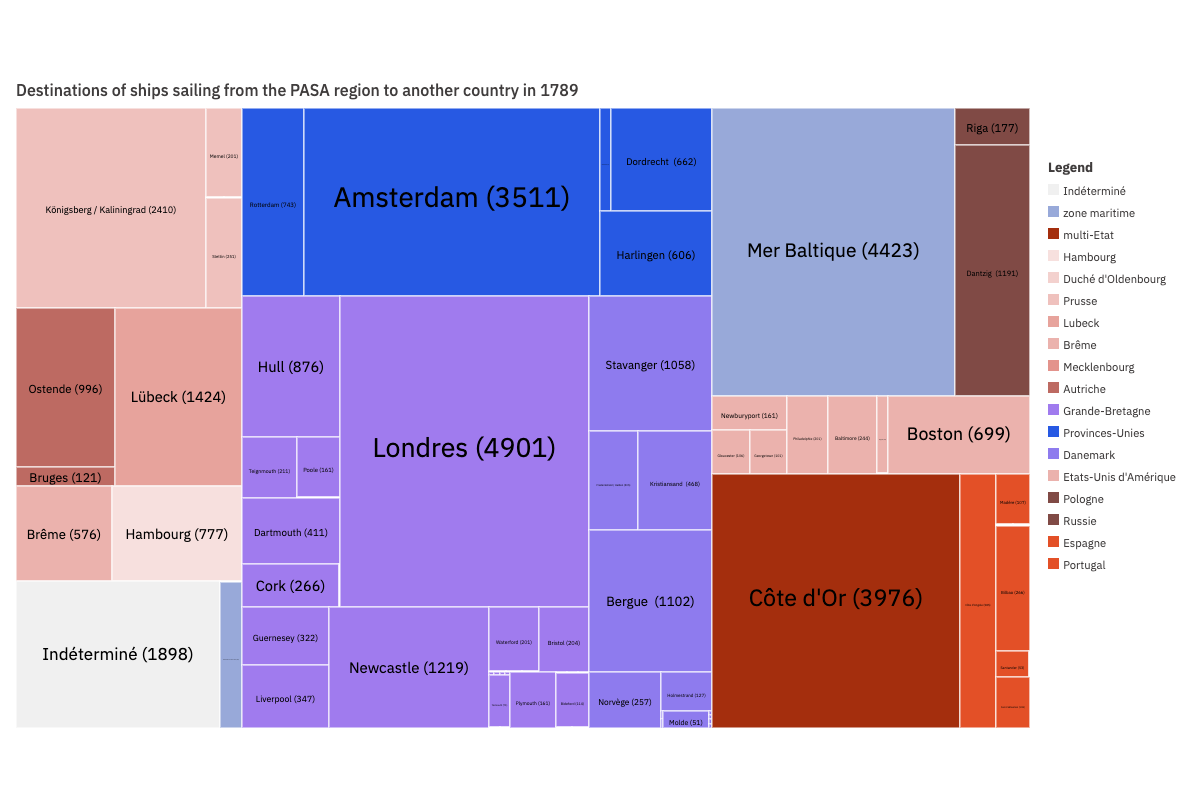
Destinations of ships sailing from the PASA region to another country in 1789
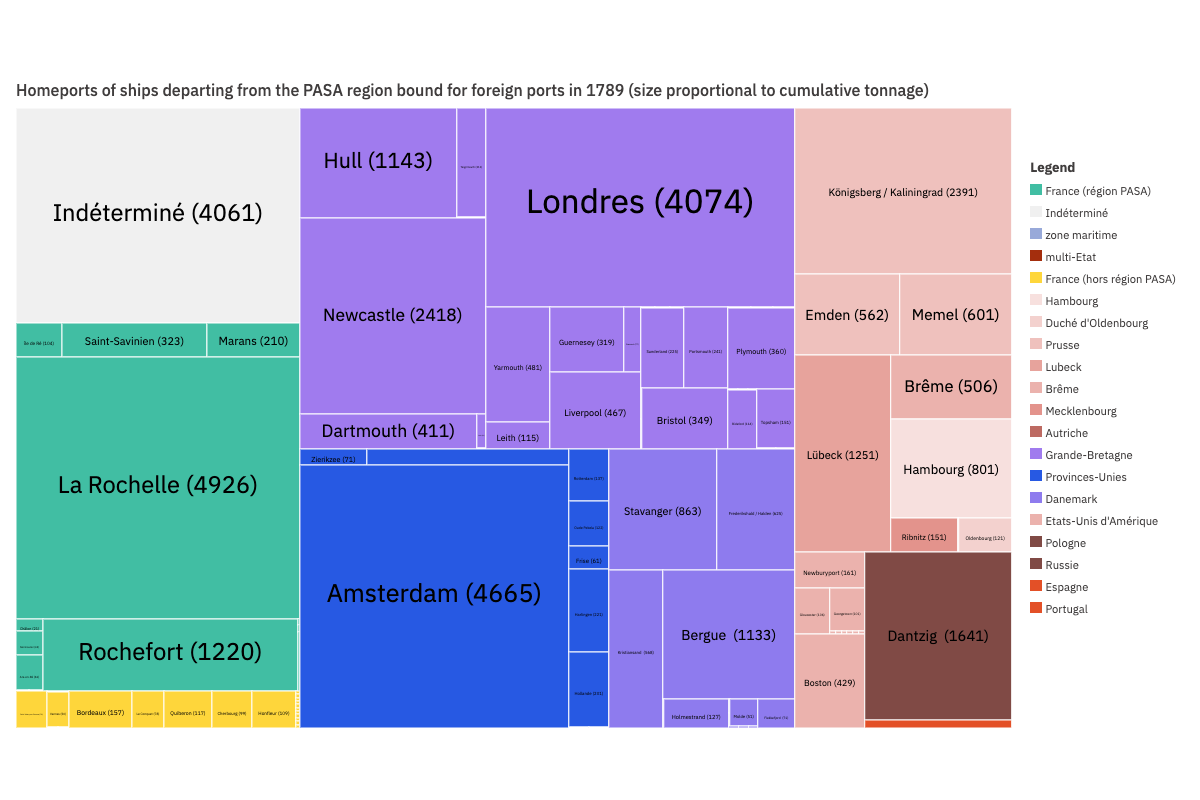
Home port of ships sailing to another country in 1789
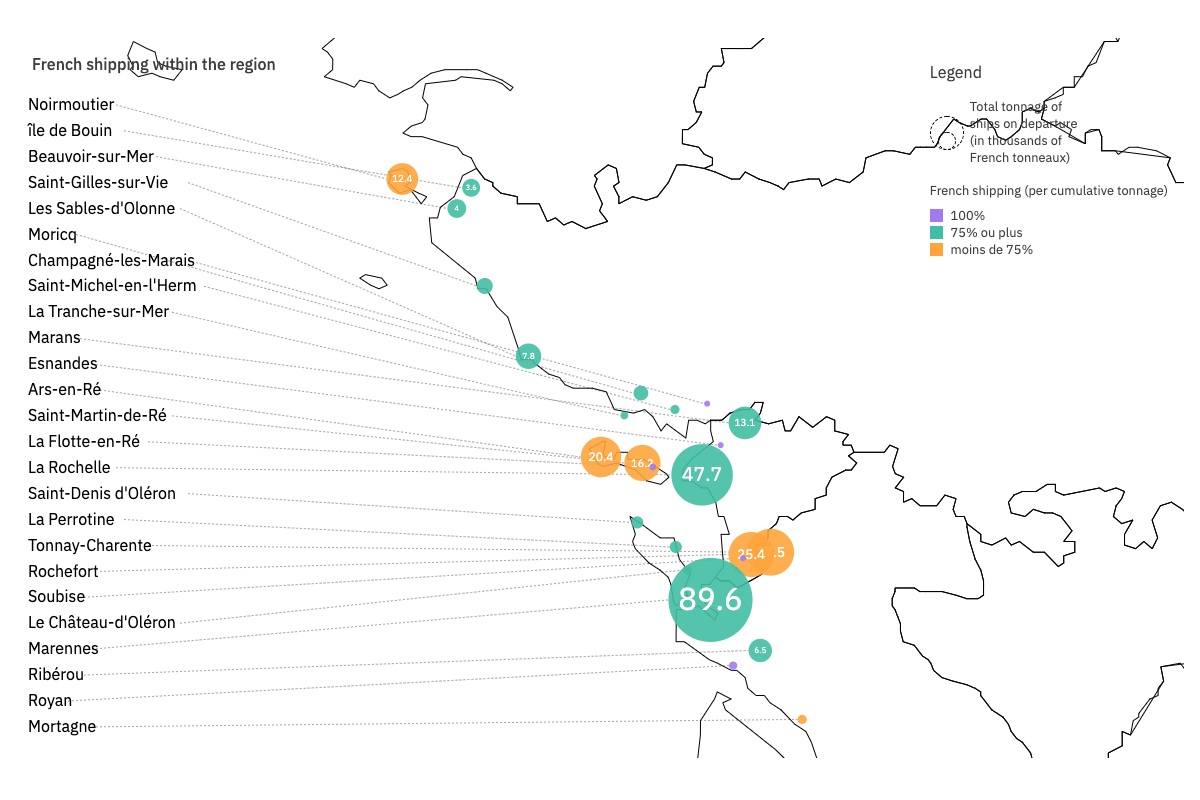
Share of French navigation in the region
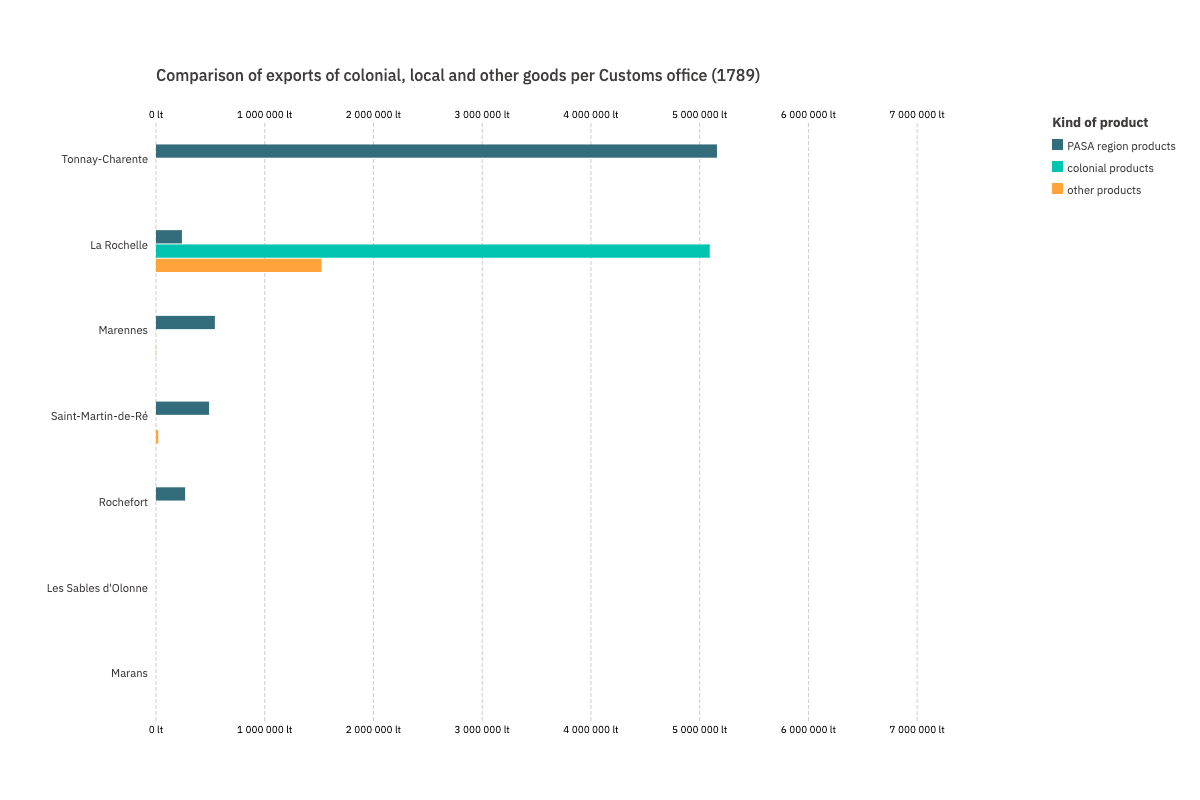
Comparison of colonial, local, and other exports by customs office
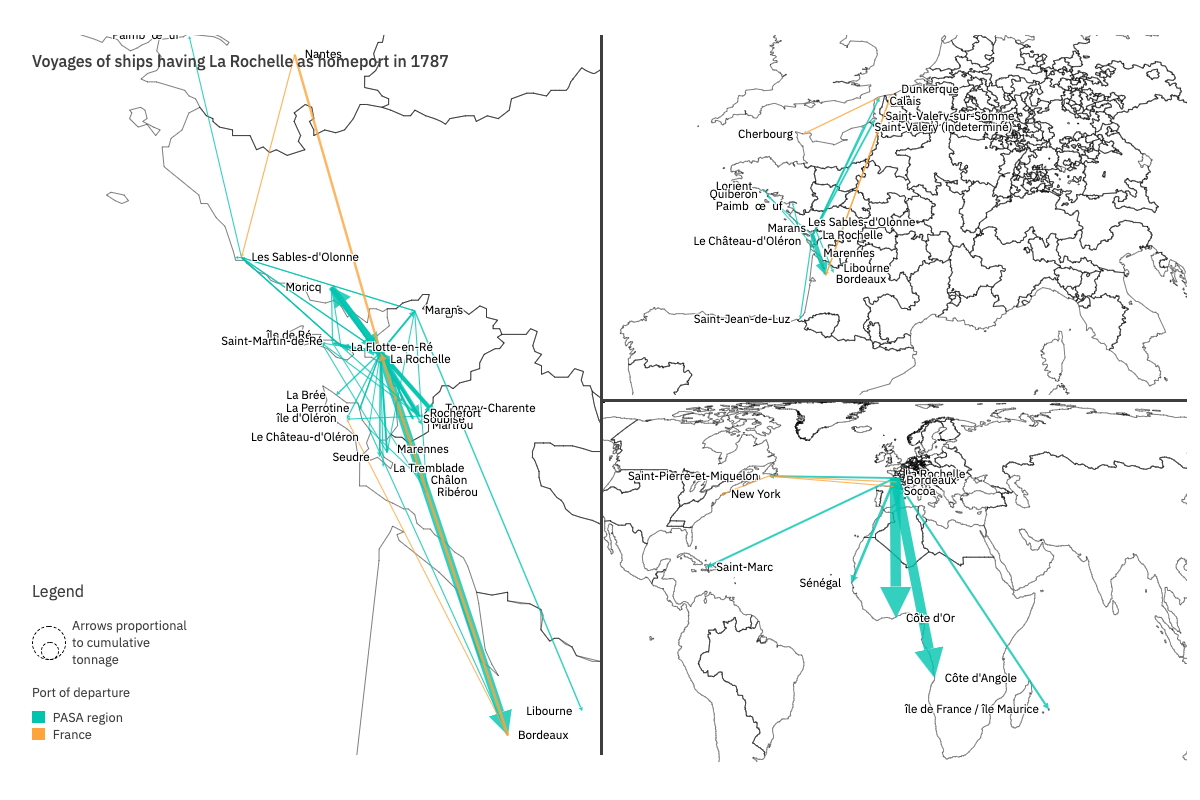
Flows of ships outfitted by the port of La Rochelle in 1787
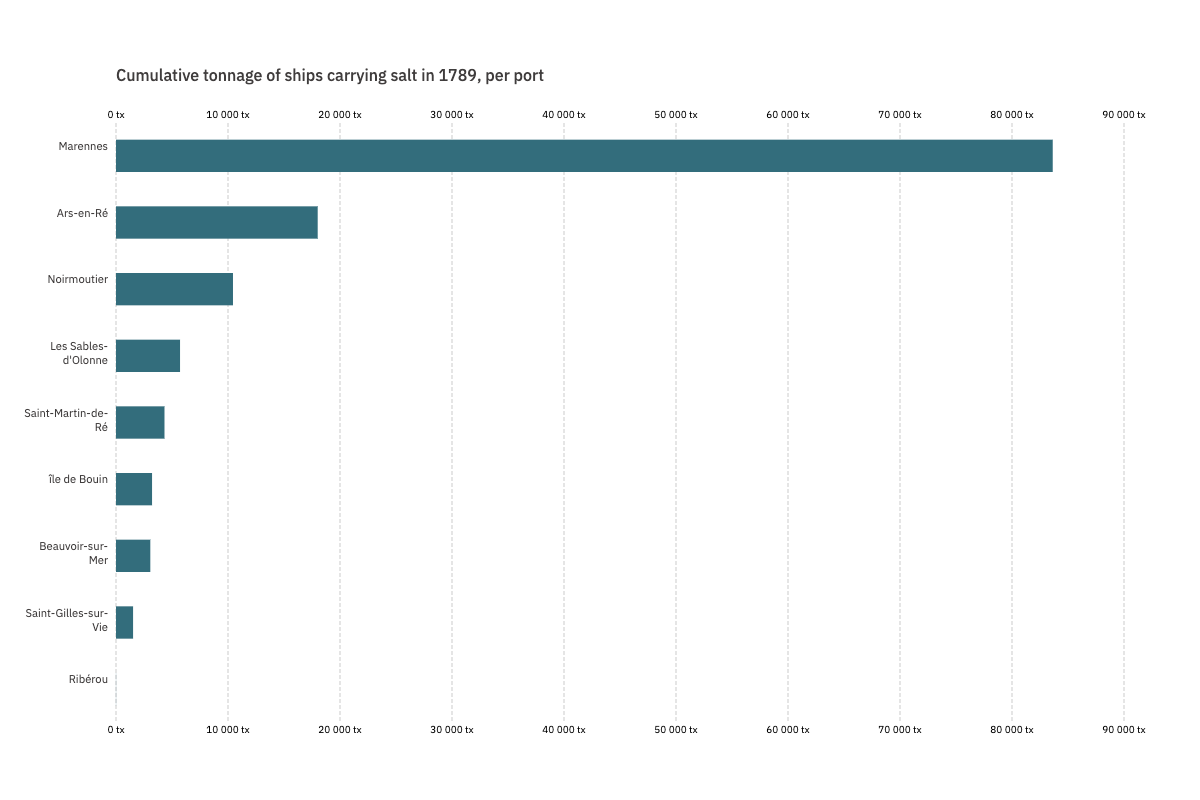
Ports of departure of vessels transporting salt in 1789 from the PASA region, aggregated by cumulative tonnage
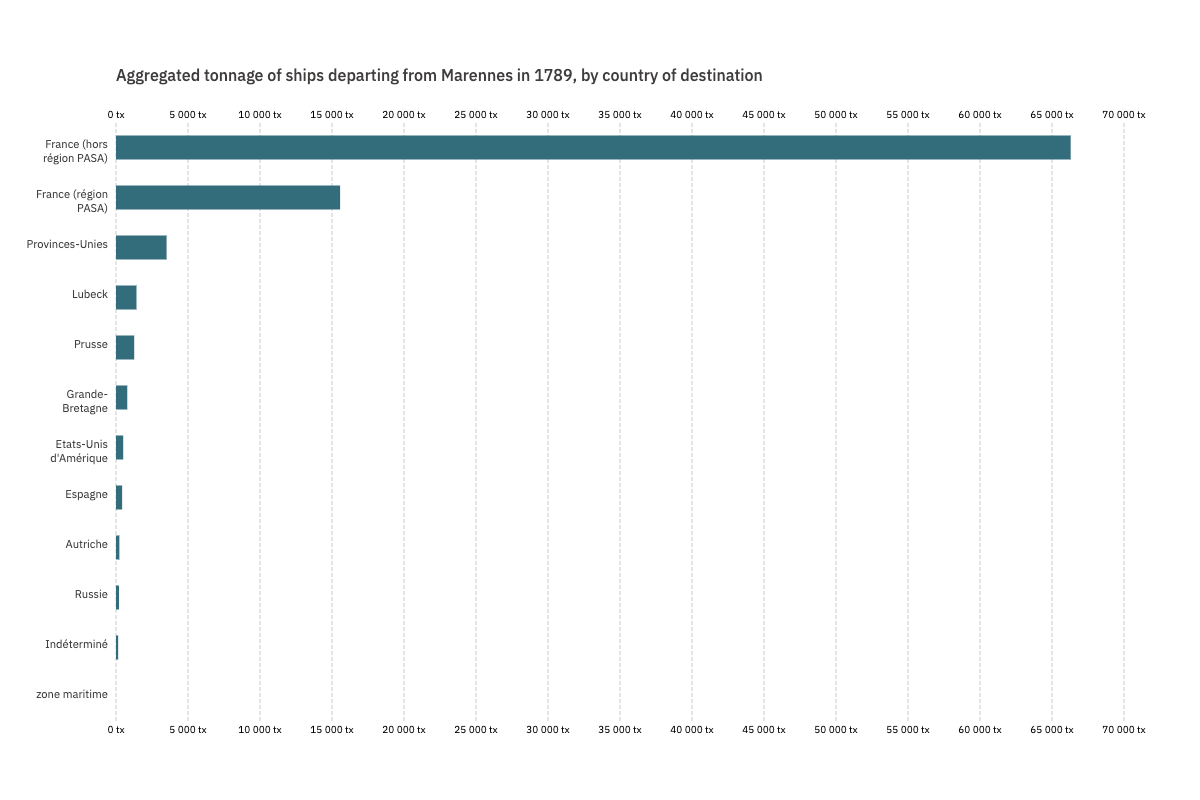
Destination of ships departing from Marennes in 1789, aggregated by country and by cumulative tonnage
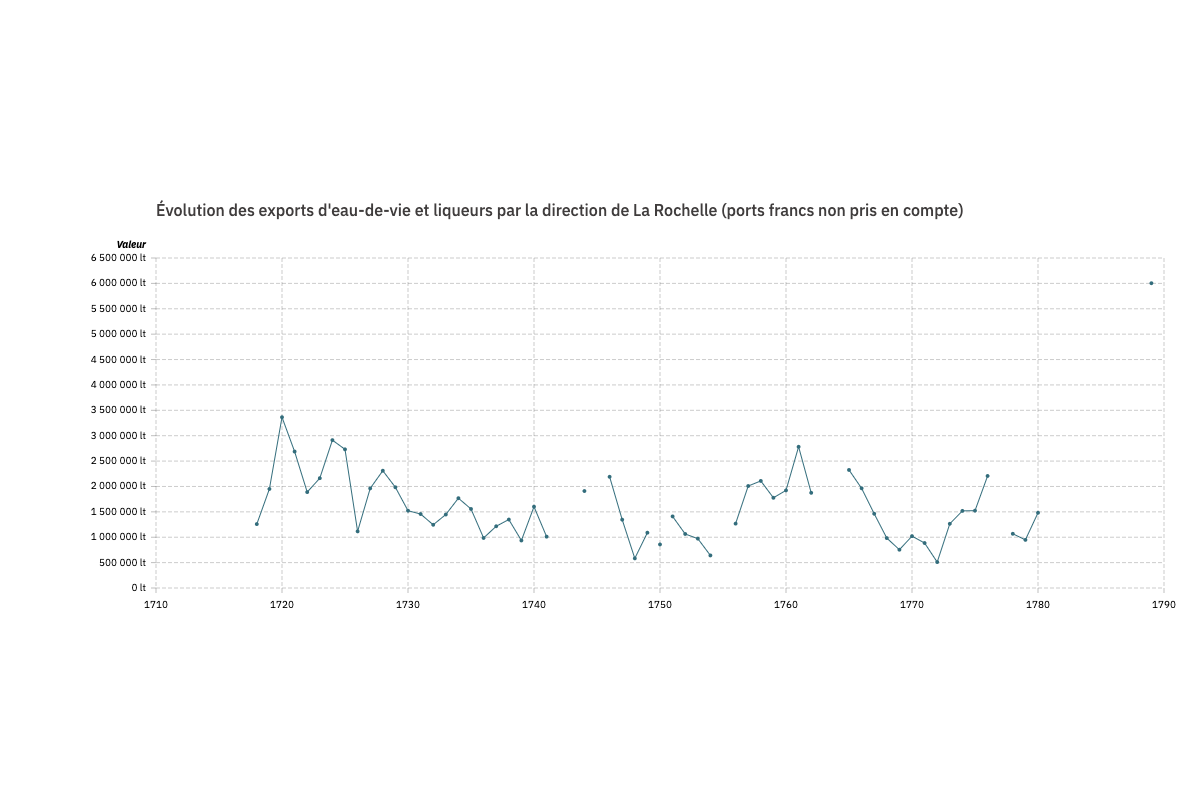
Evolution of brandy exports from the La Rochelle customs region (free ports not included)
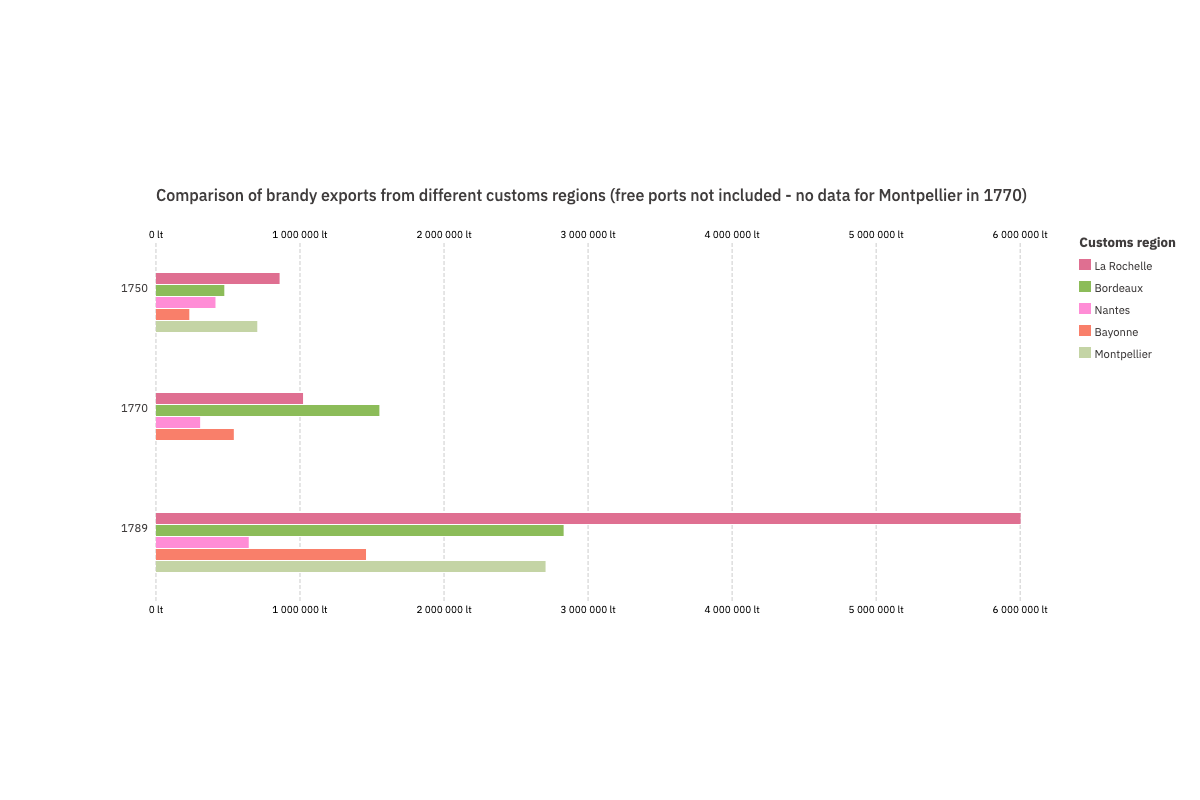
Comparison of brandy exports from different customs regions (free ports not included - no data for Montpellier in 1770)
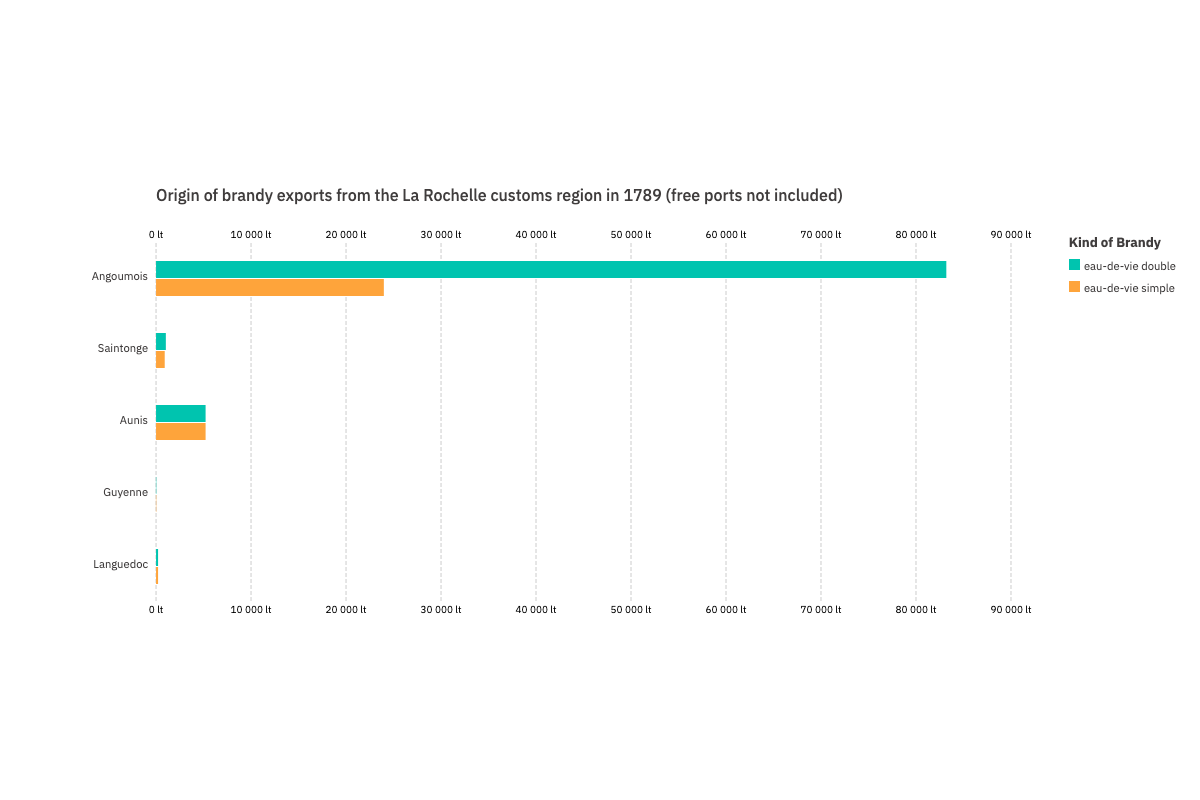
Origin of brandy exports from the La Rochelle customs region in 1789 (free ports not included)
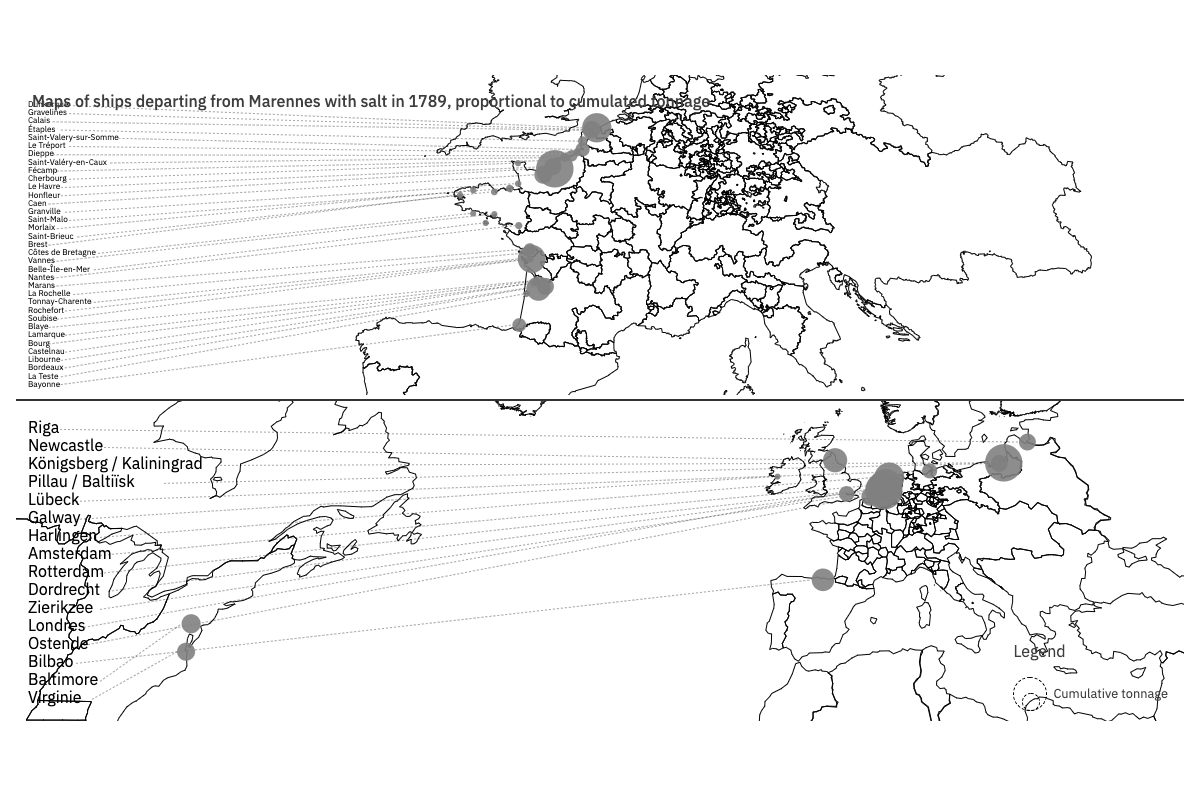
Maps of ships leaving Marennes with salt in 1789, sized by cumulative tonnage
Share of French navigation in the region
How were the data and visualization produced ?
Data was drawn from the Navigocorpus database, and concern ship departures in 1789 from the ports of the Poitou-Aunis-Saintonge region studied (point calls observed).The size of each dot corresponds to the cumulative tonnage of ships leaving the port in 1789. The color corresponds to the share of French navigation in departures from these ports based on the home port of the vessels.
How to read the visualization?
This chart differentiates the ports of the region by the number of their flows and their ability to attract foreign fleets. The size of each dot corresponds to the cumulative tonnage of ships leaving the port in 1789, all flags combined. The tonnage is expressed in tonneaux (1 tx is approximately 1.44 cubic meters). The color shows the importance of foreign vessels in local navigation based on the reported home port: only a few very small ports (in purple) were not served by foreign ships. However, the ports most open to foreign navigation (in orange) were not necessarily the most important in terms of total tonnage. This was the case of Rochefort, for instance, whose arsenal was supplied by ships from northern Europe, of the port of Tonnay-Charente, a major brandy exporter, and of some salt ports (Île de Ré and Noirmoutier).