Visualizations atlas
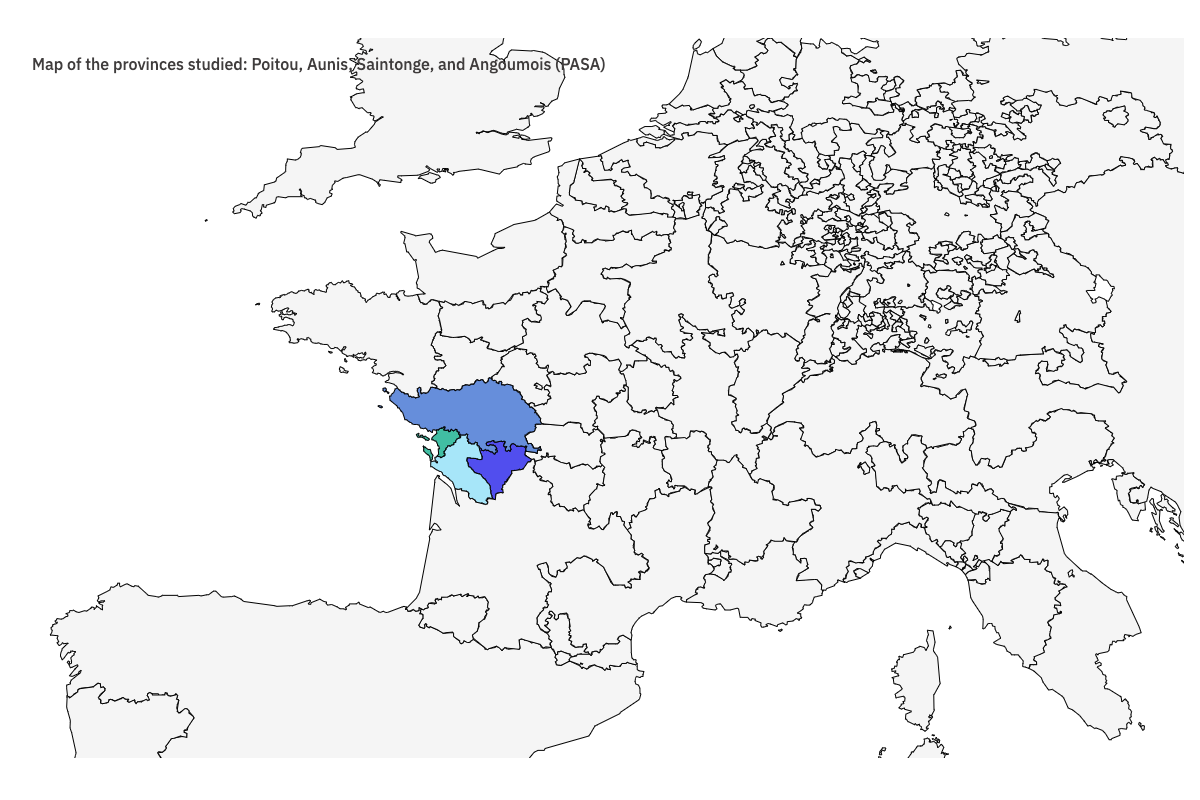
Map of the provinces investigated : Poitou, Aunis, Saintonge, Angoumois (PASA)
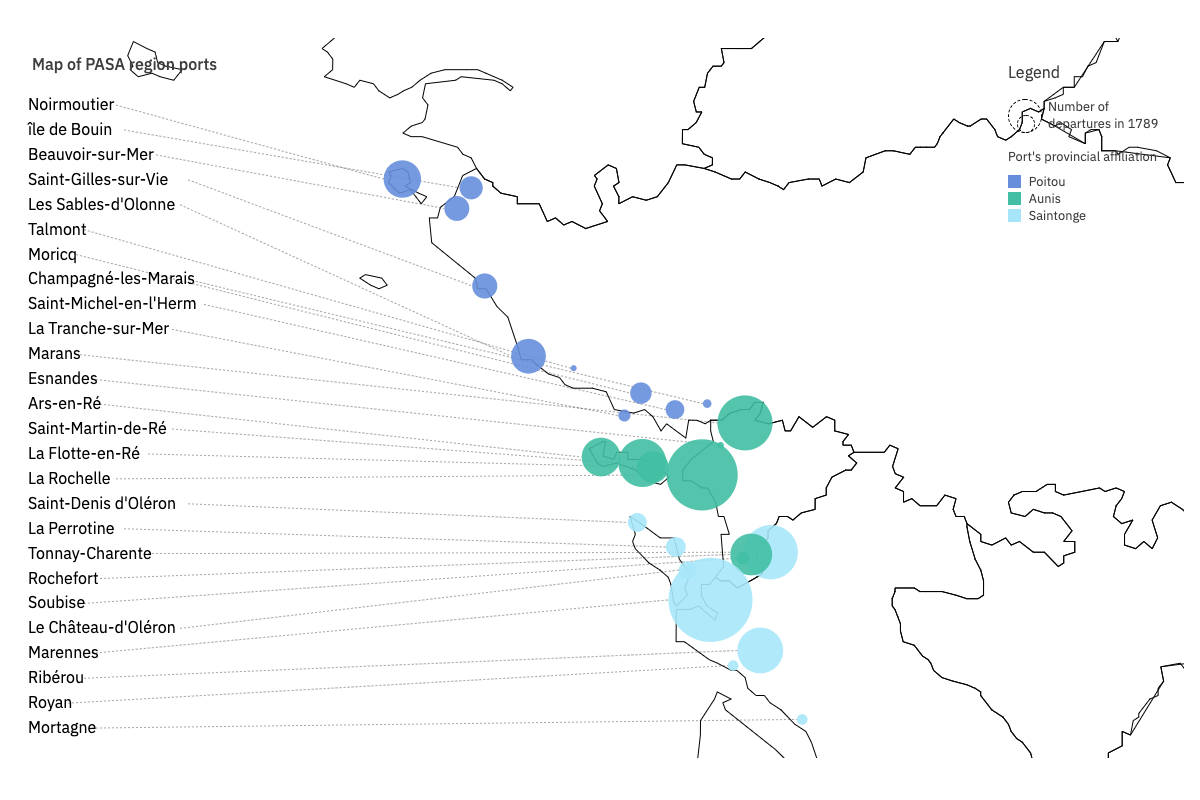
Map of PASA region ports
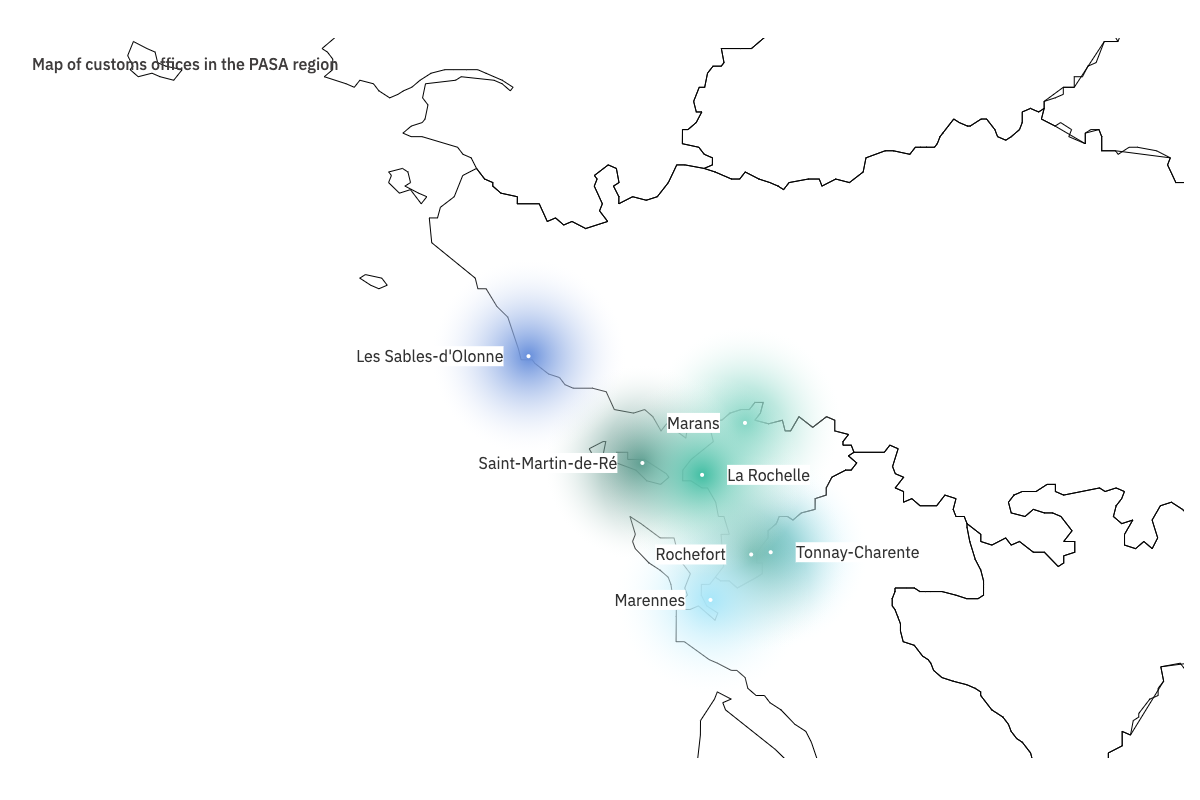
Map of customs offices in the PASA region
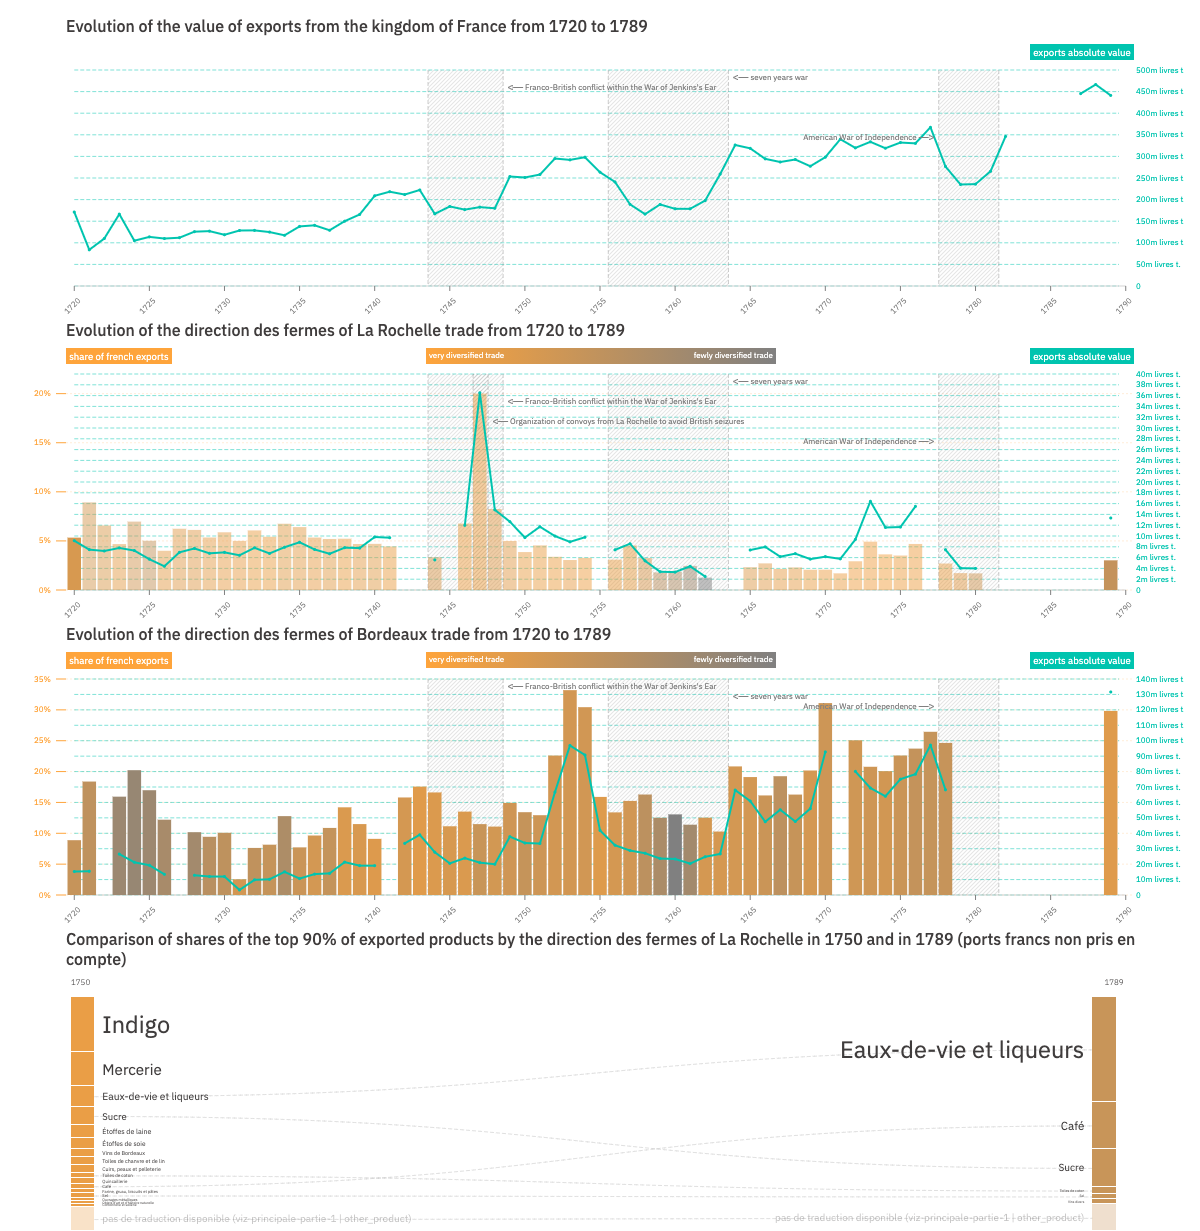
The decline of the La Rochelle region following the loss of Canada
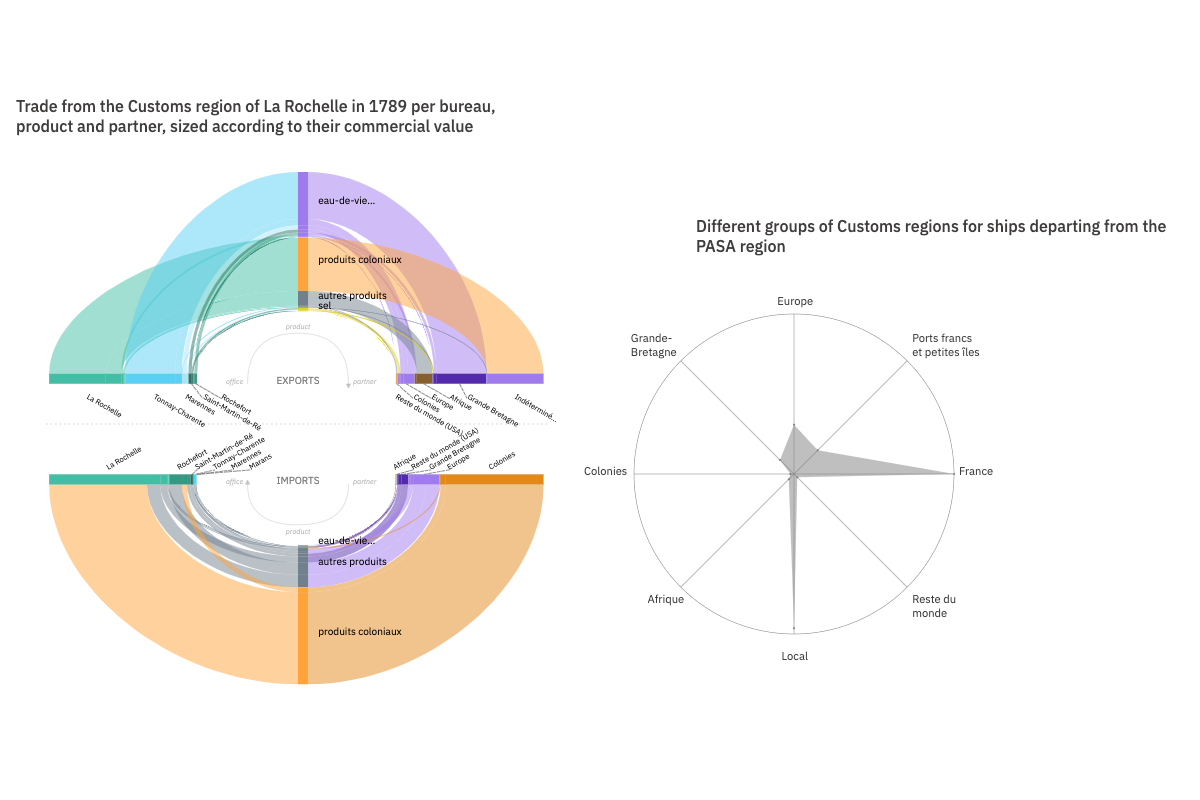
Highly specialized ports: the slave trade, the salt trade, and the brandy trade
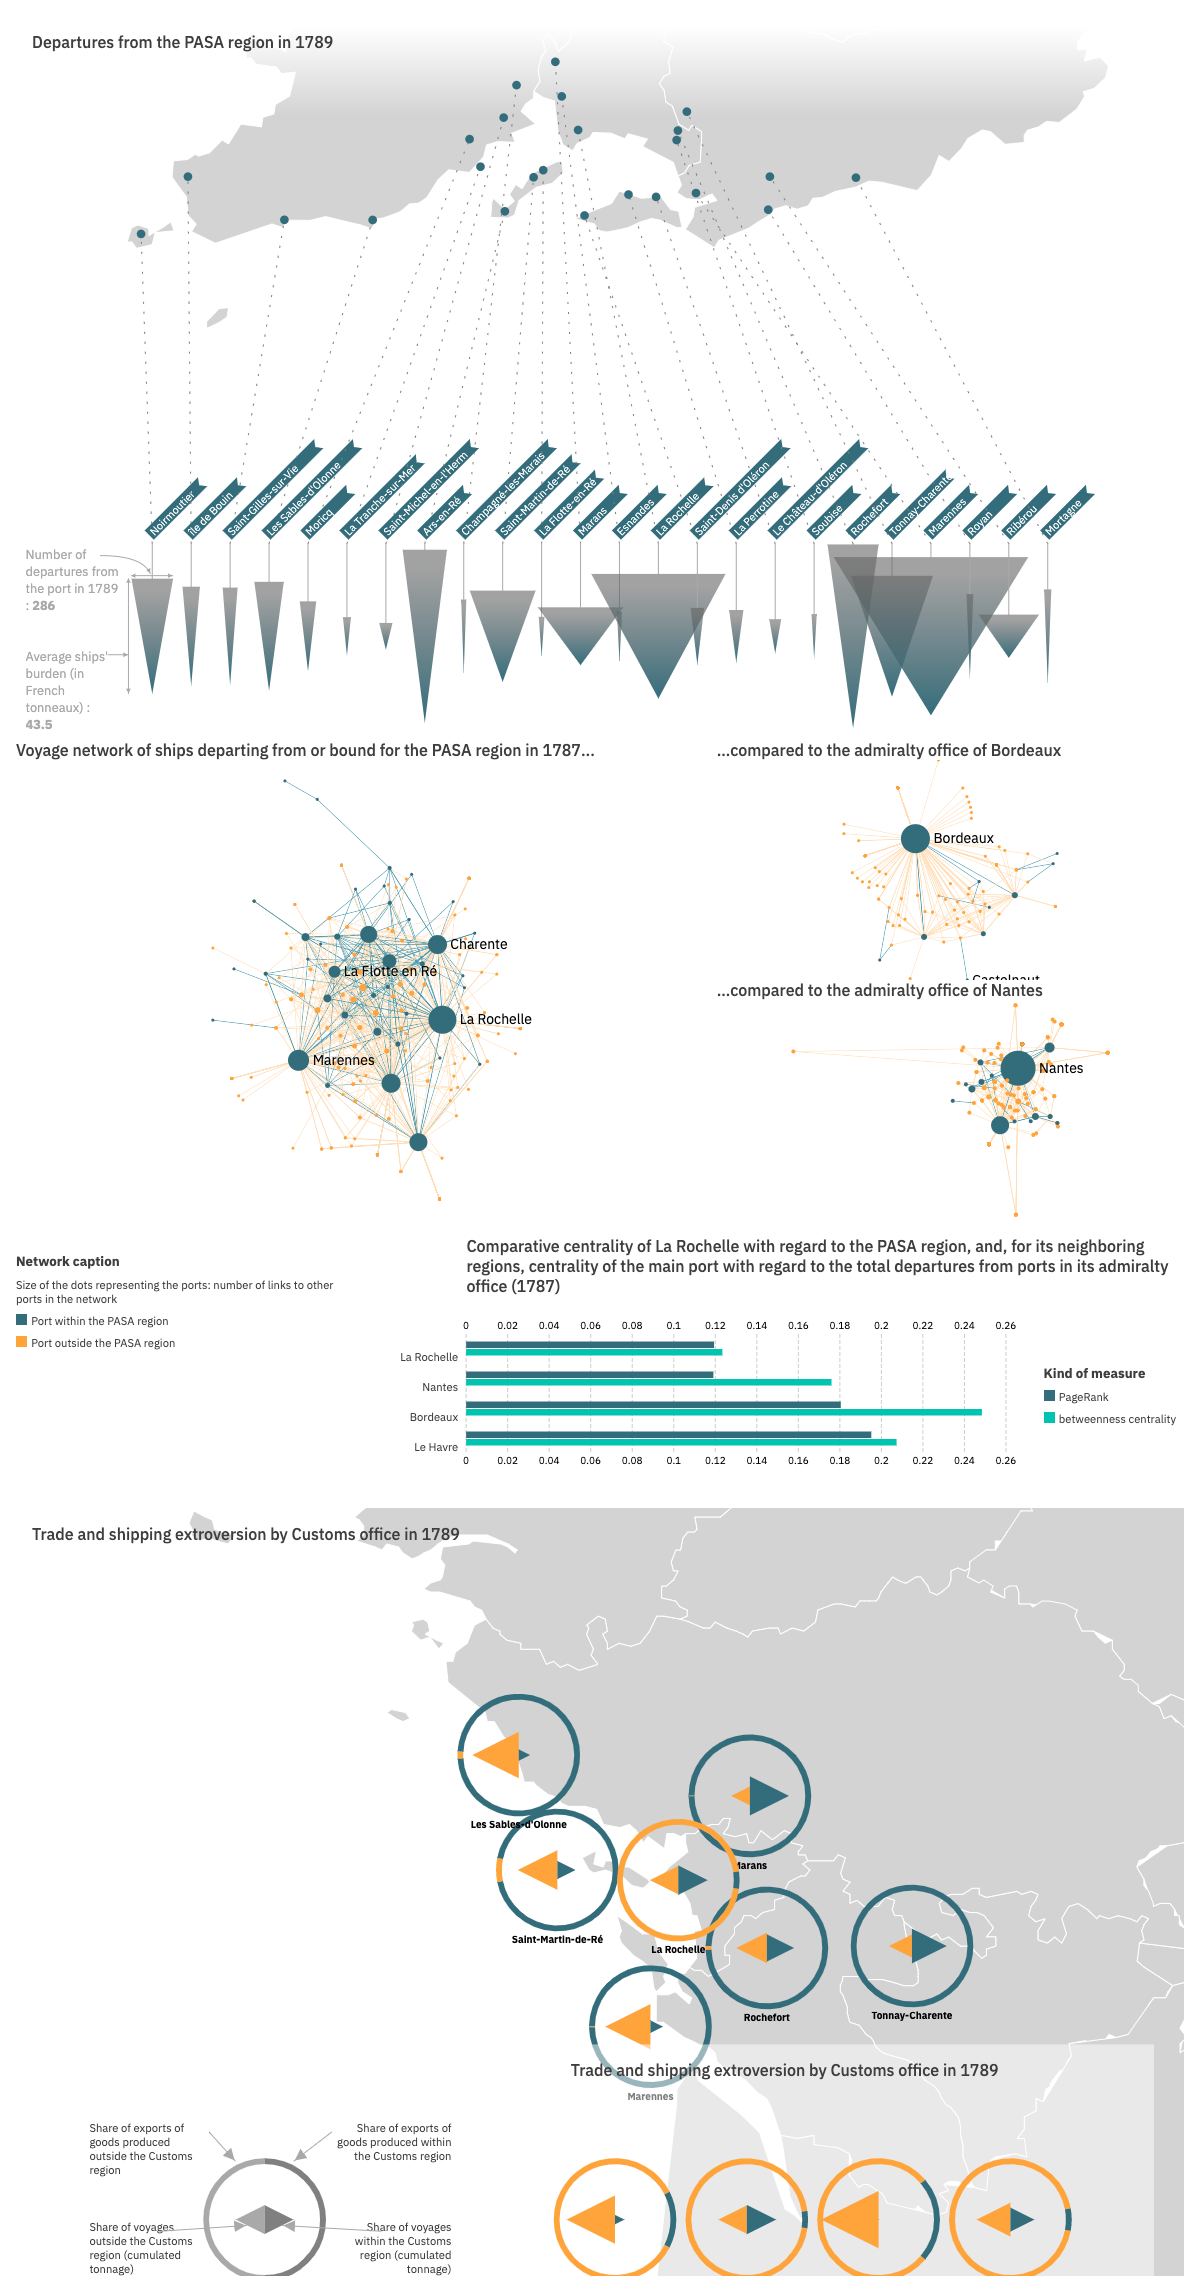
La Rochelle, a dominating port but not a regional hub
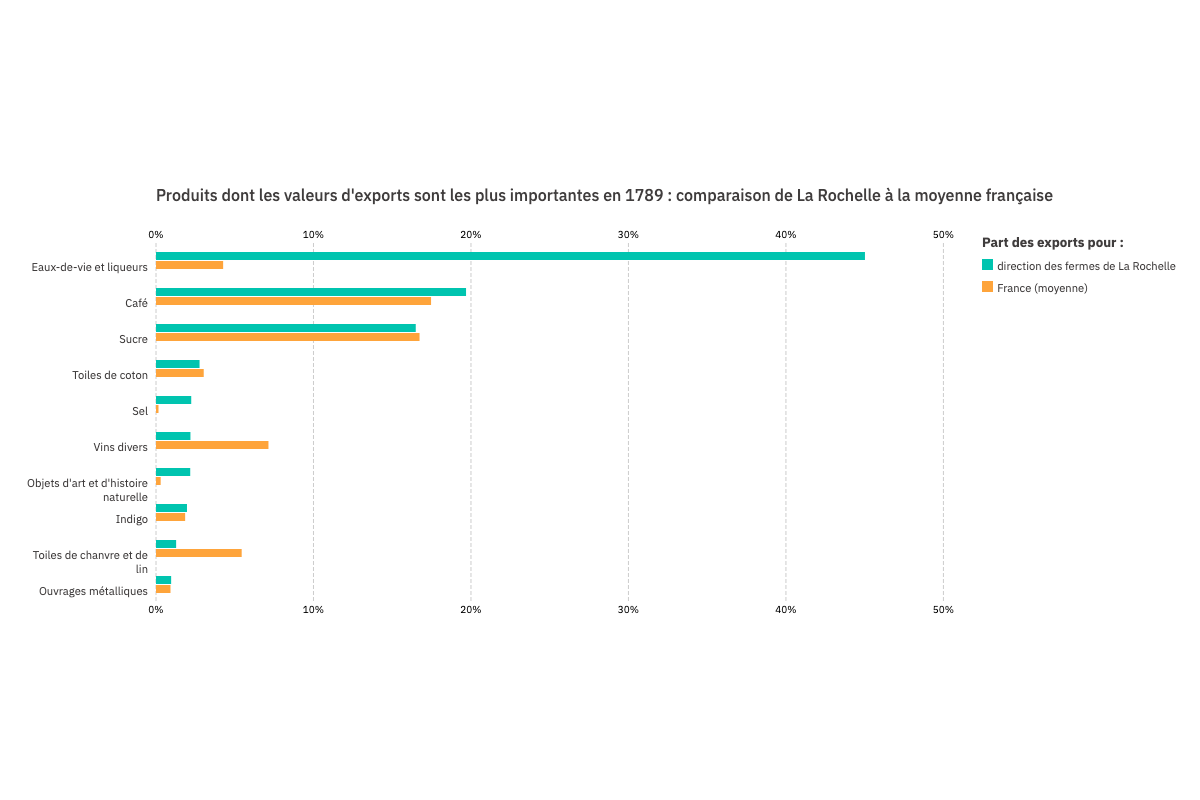
Products with the highest export value in 1789: comparison between the La Rochelle customs region and the French average
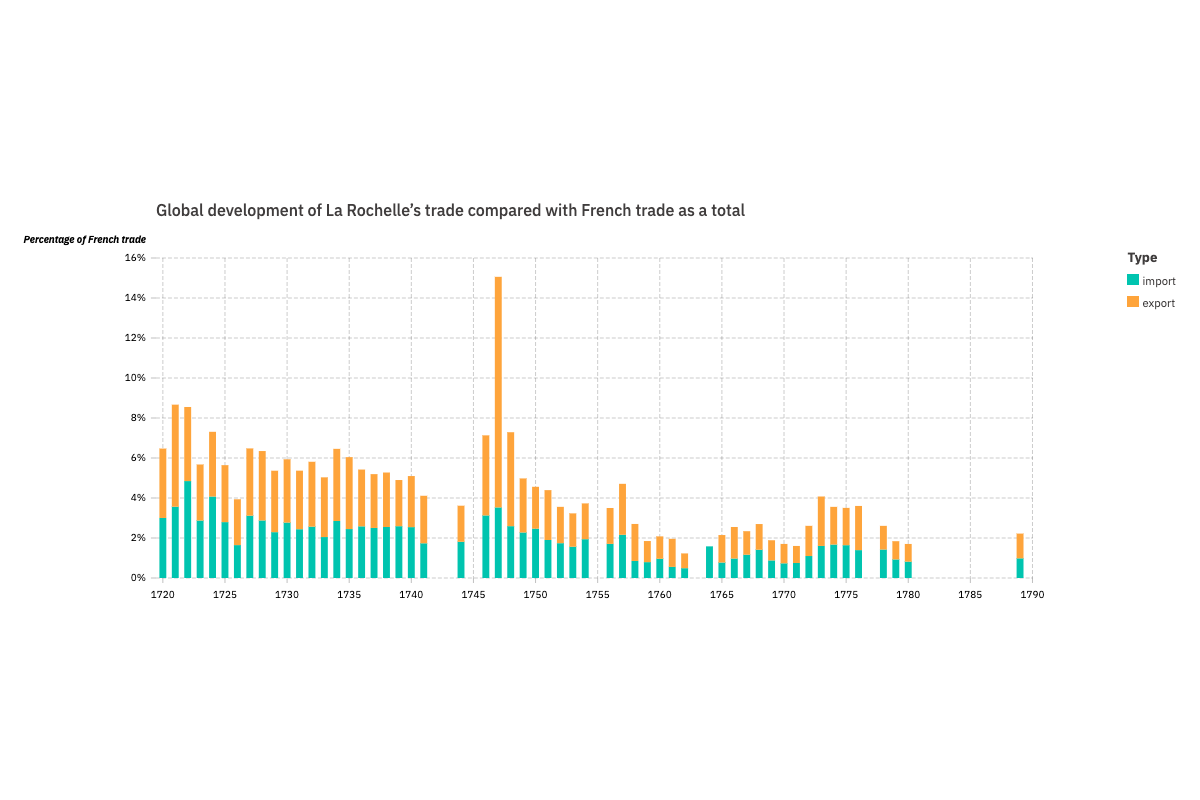
Evolution of the share of La Rochelle trade in relation to France as a whole
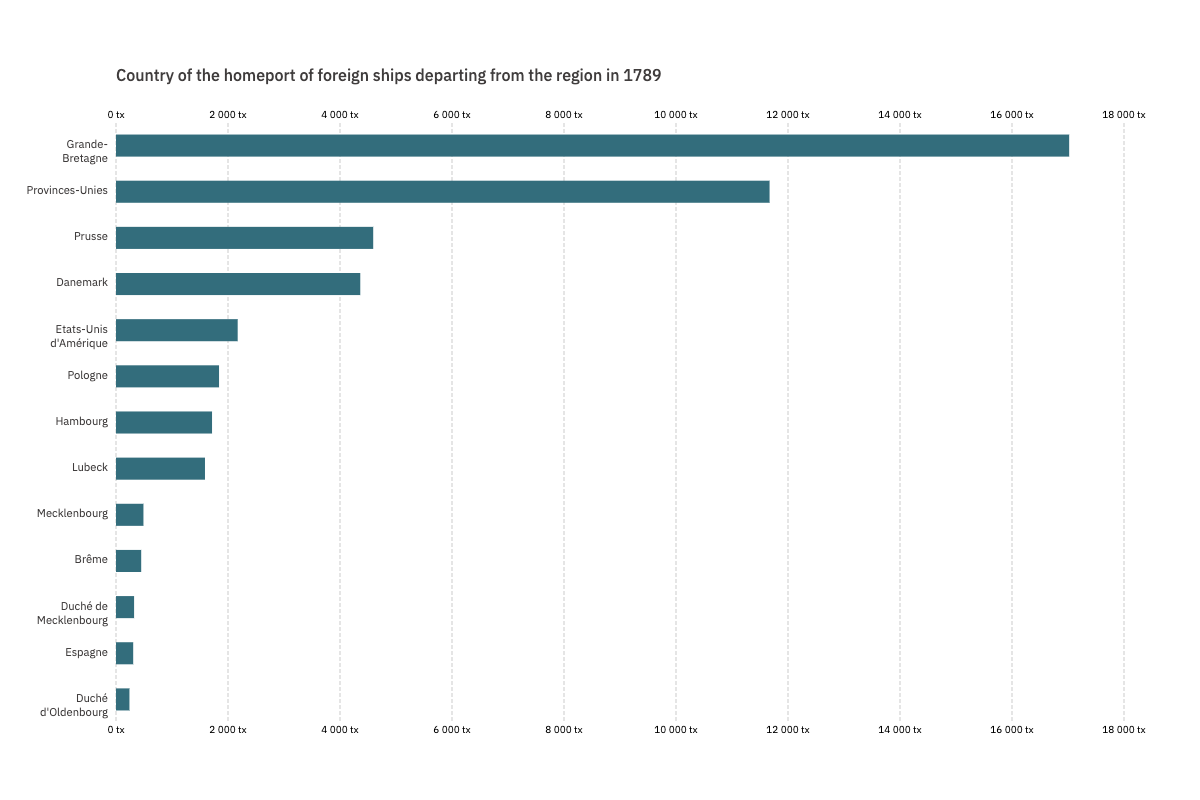
Home country of ships departing from the region in 1789
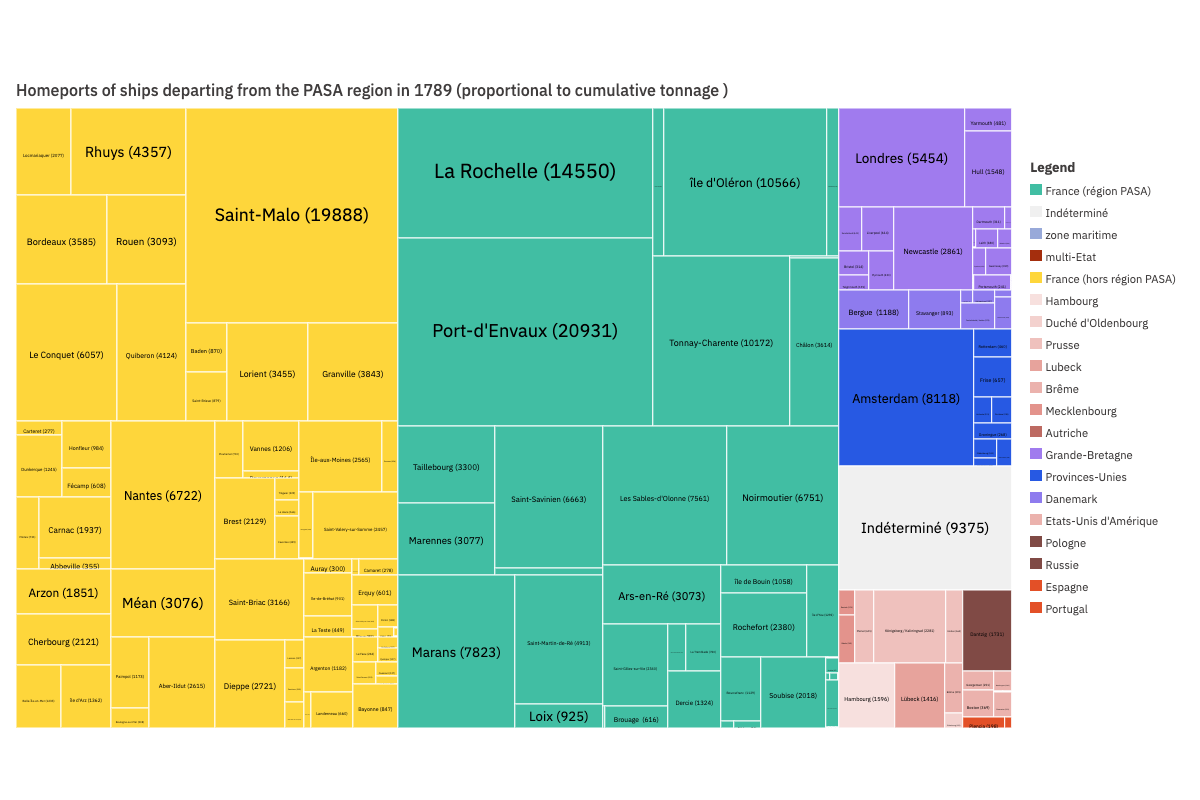
Home ports of ships departing from the PASA region in 1789
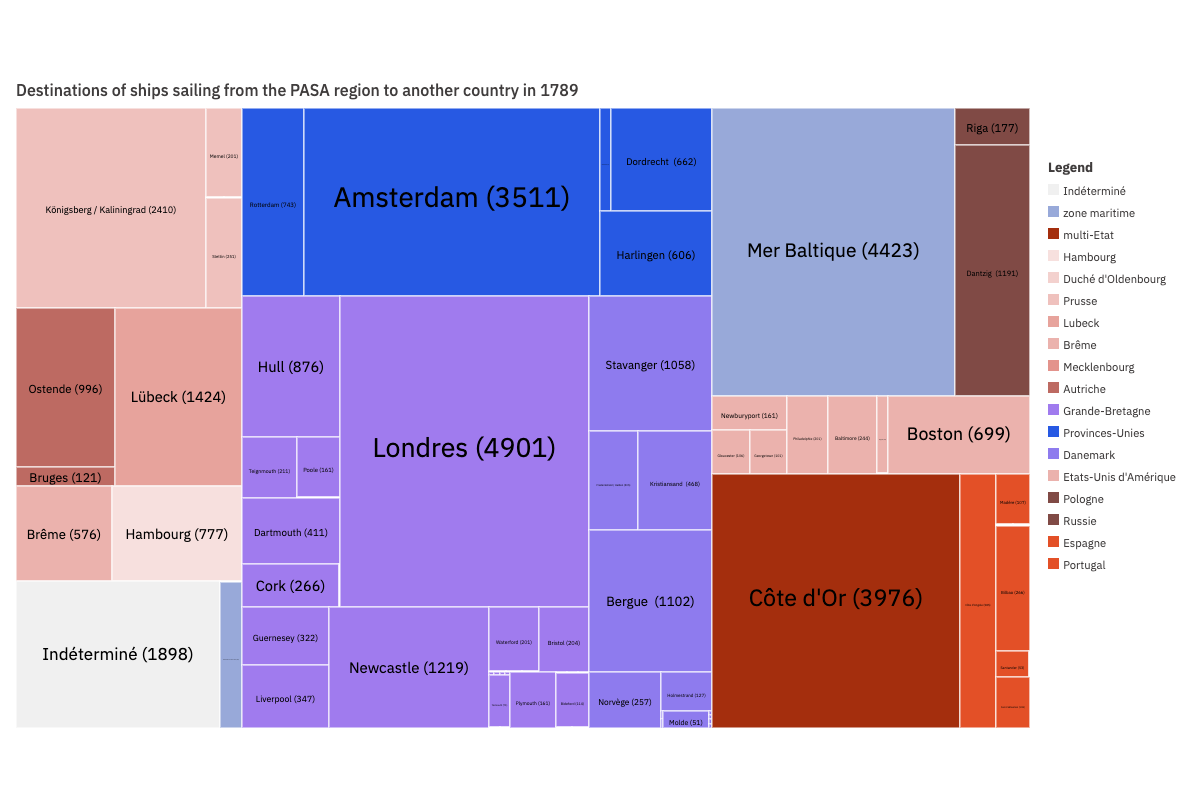
Destinations of ships sailing from the PASA region to another country in 1789
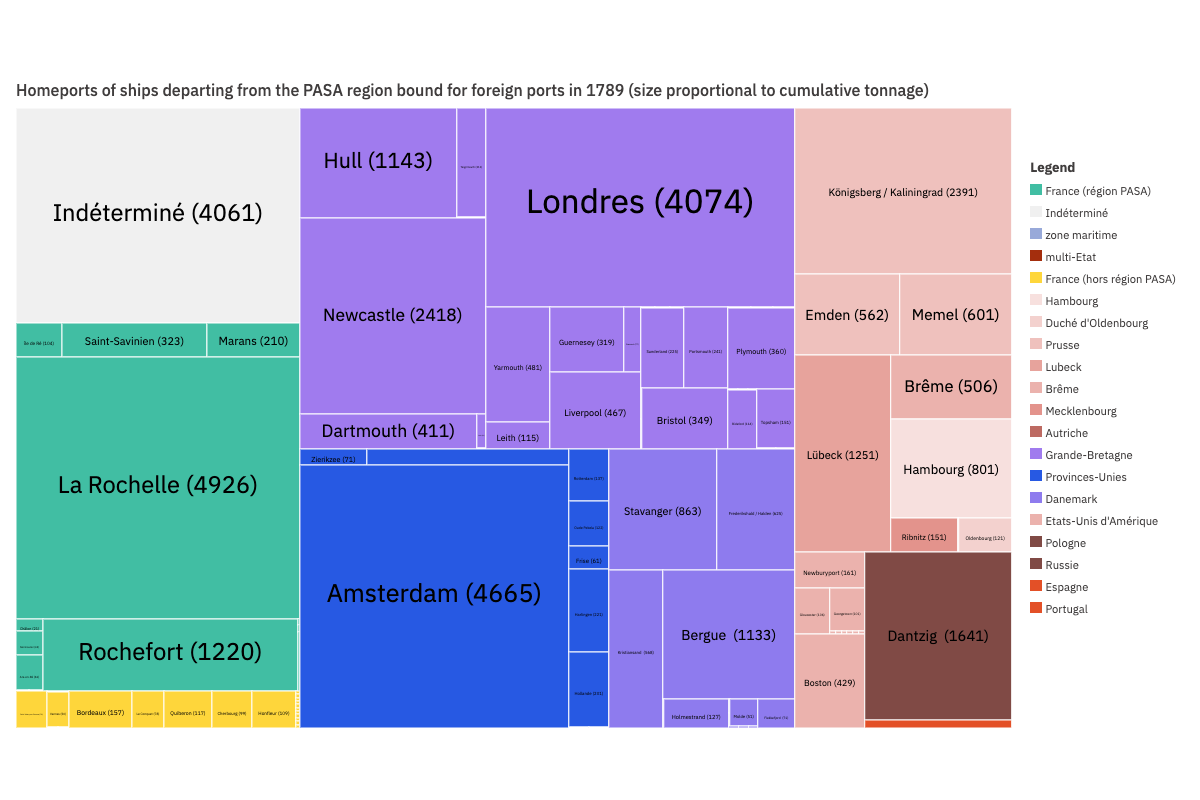
Home port of ships sailing to another country in 1789
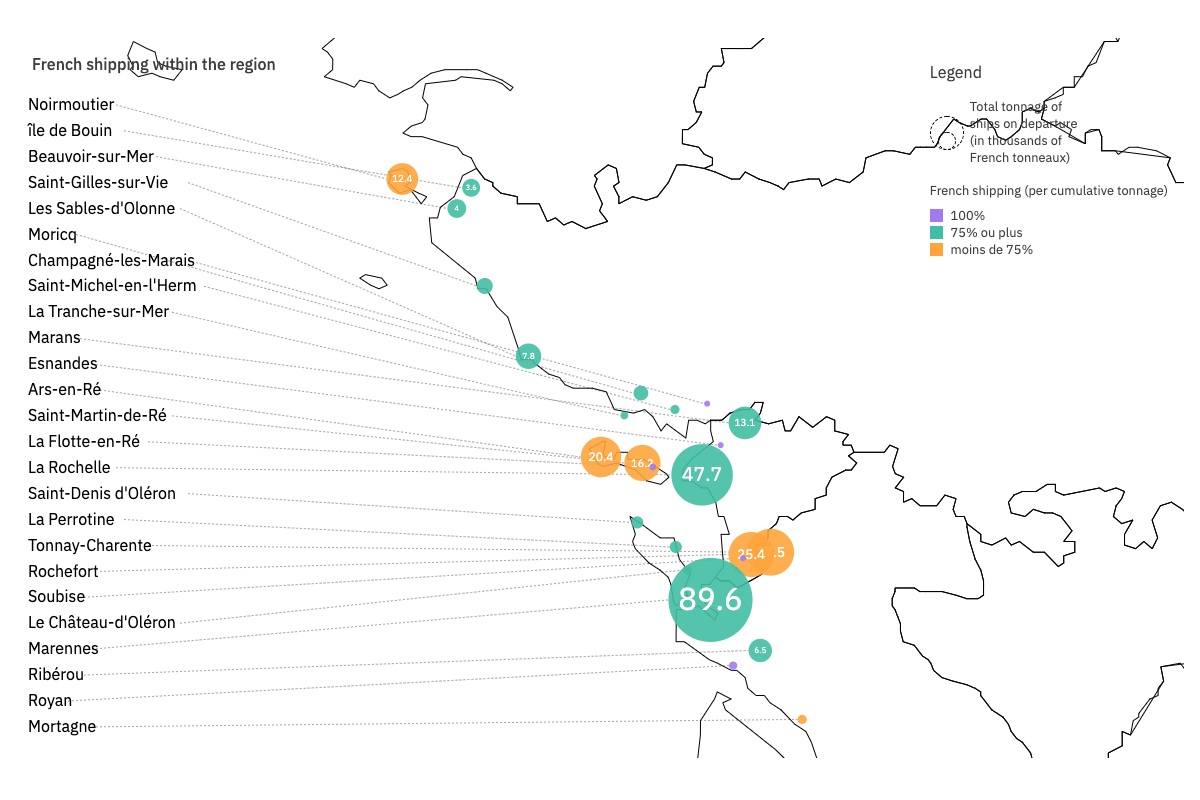
Share of French navigation in the region
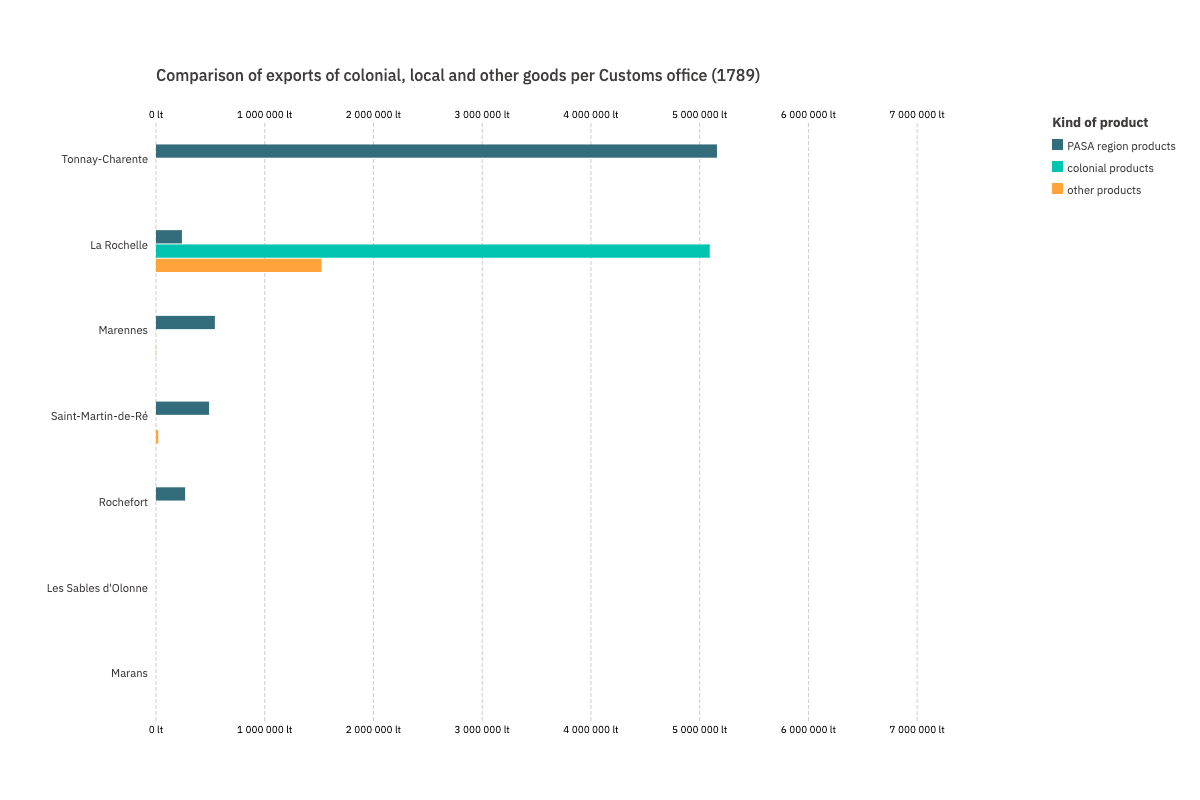
Comparison of colonial, local, and other exports by customs office
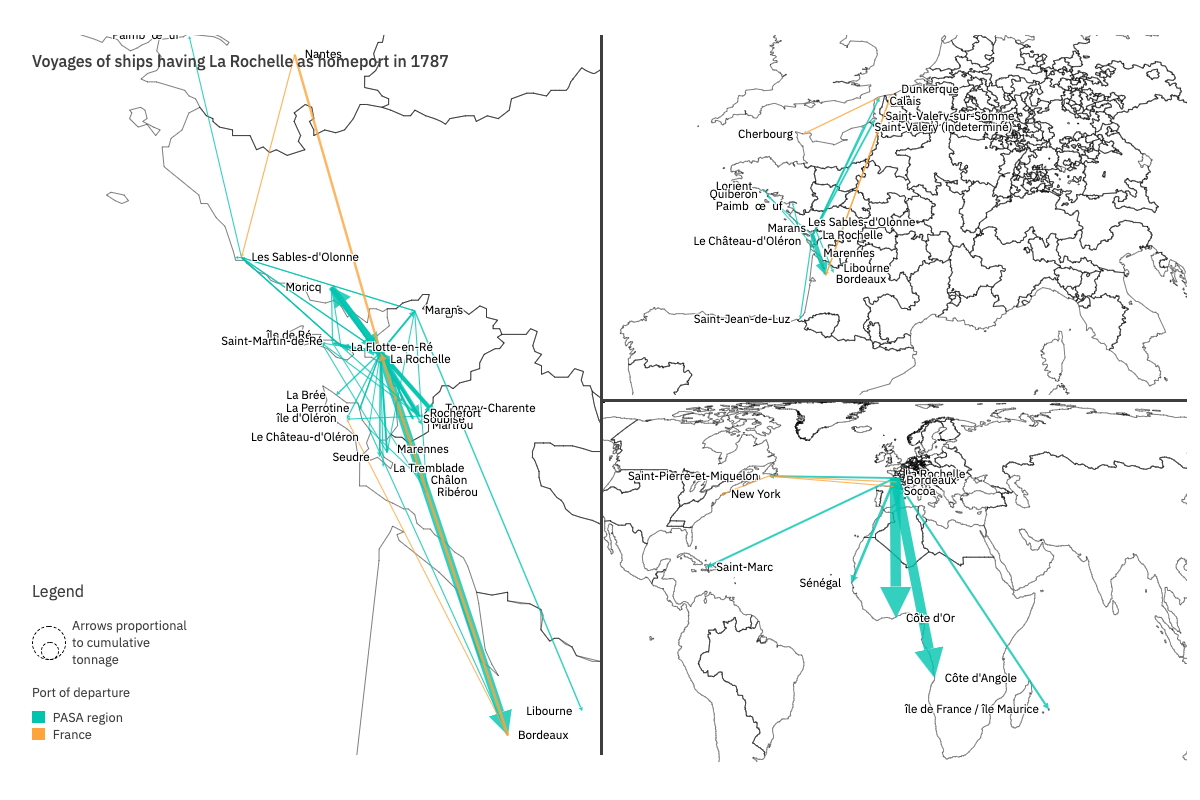
Flows of ships outfitted by the port of La Rochelle in 1787
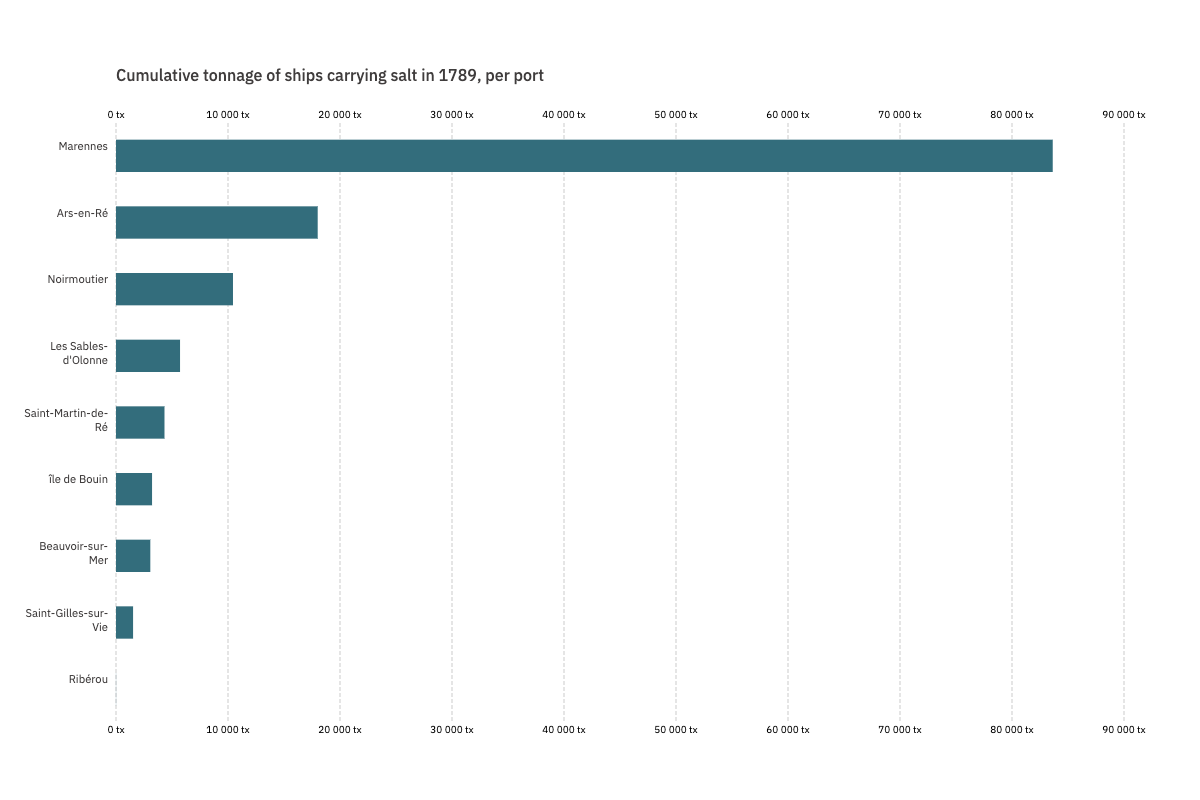
Ports of departure of vessels transporting salt in 1789 from the PASA region, aggregated by cumulative tonnage
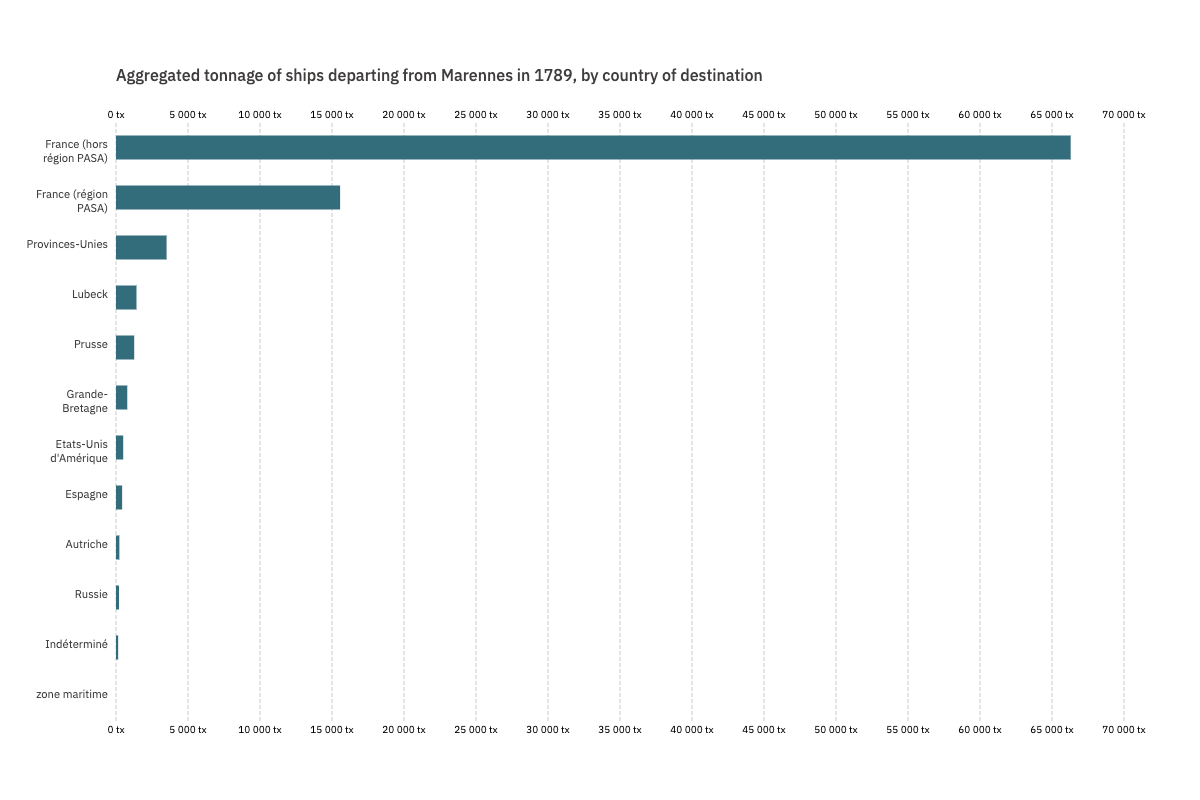
Destination of ships departing from Marennes in 1789, aggregated by country and by cumulative tonnage
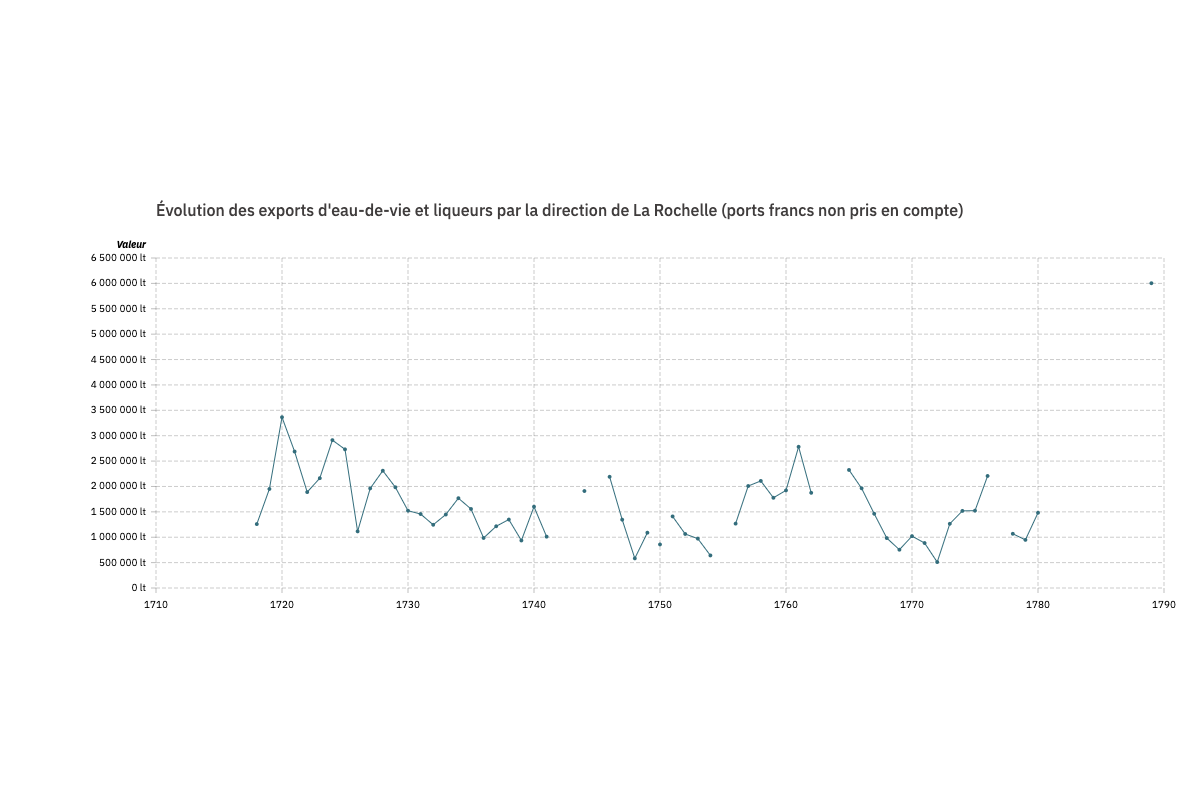
Evolution of brandy exports from the La Rochelle customs region (free ports not included)
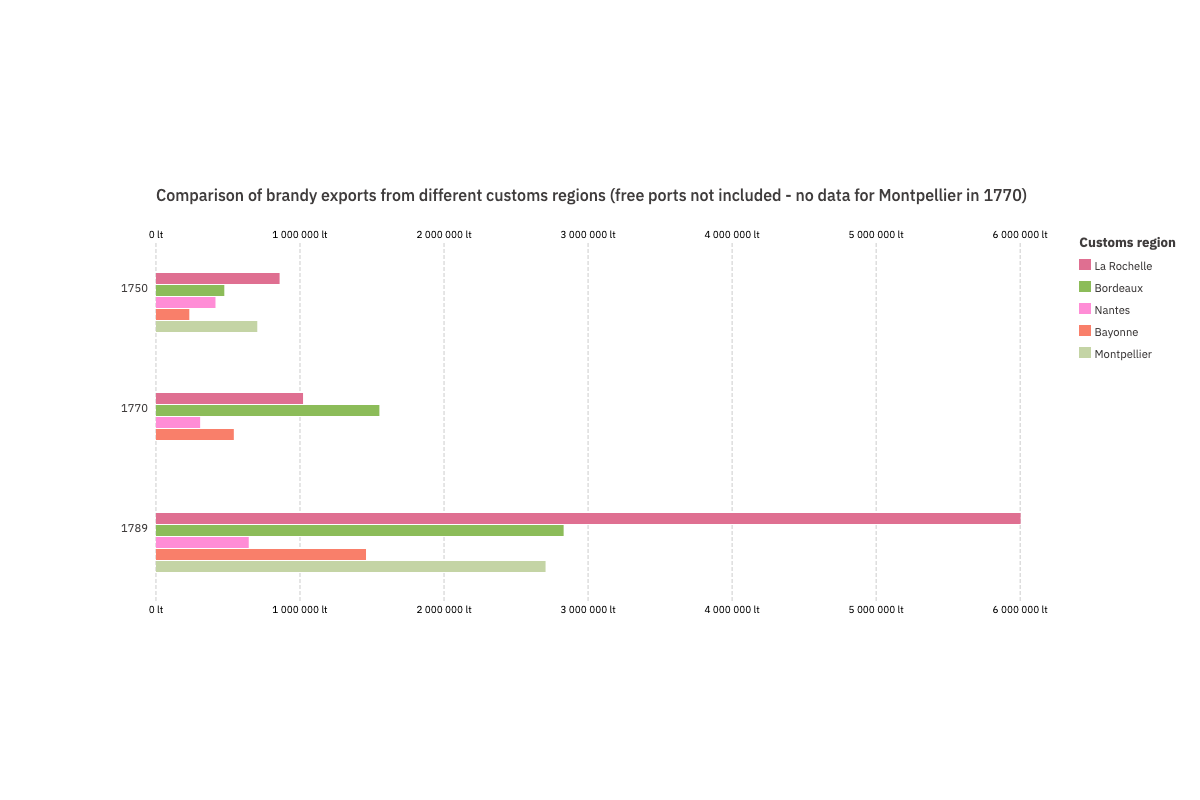
Comparison of brandy exports from different customs regions (free ports not included - no data for Montpellier in 1770)
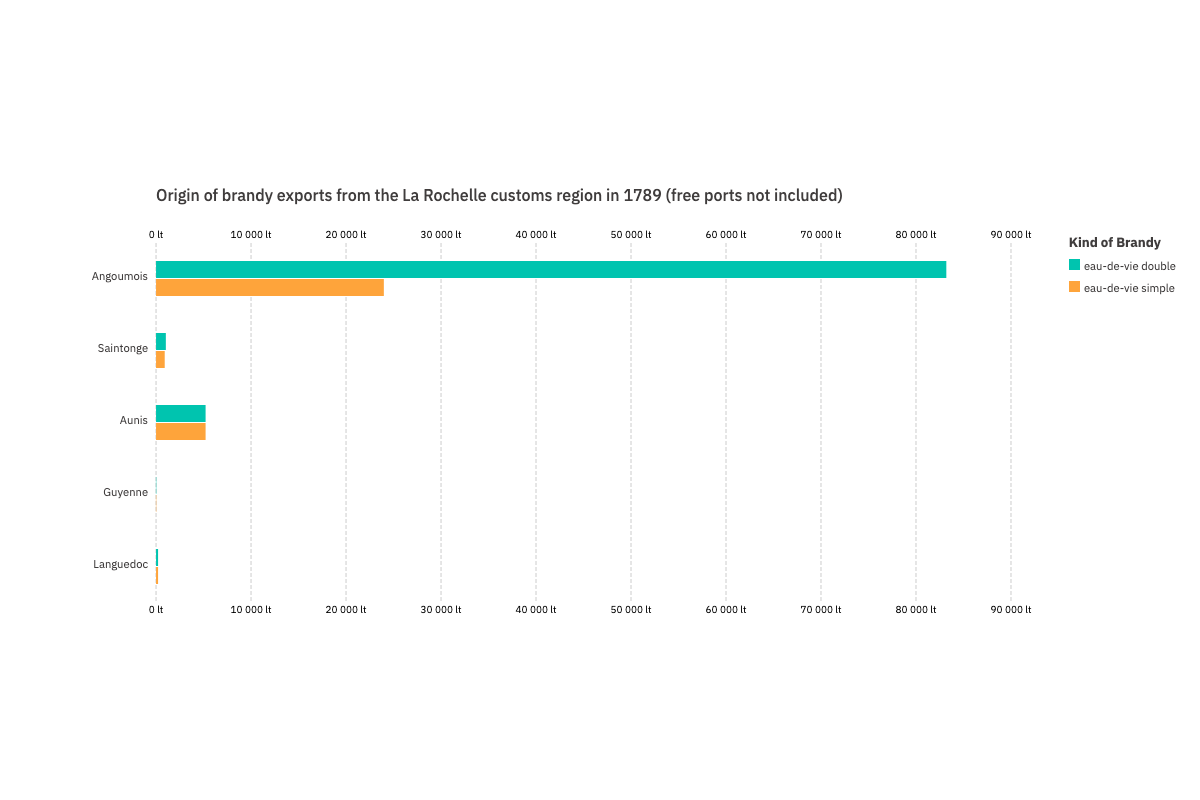
Origin of brandy exports from the La Rochelle customs region in 1789 (free ports not included)
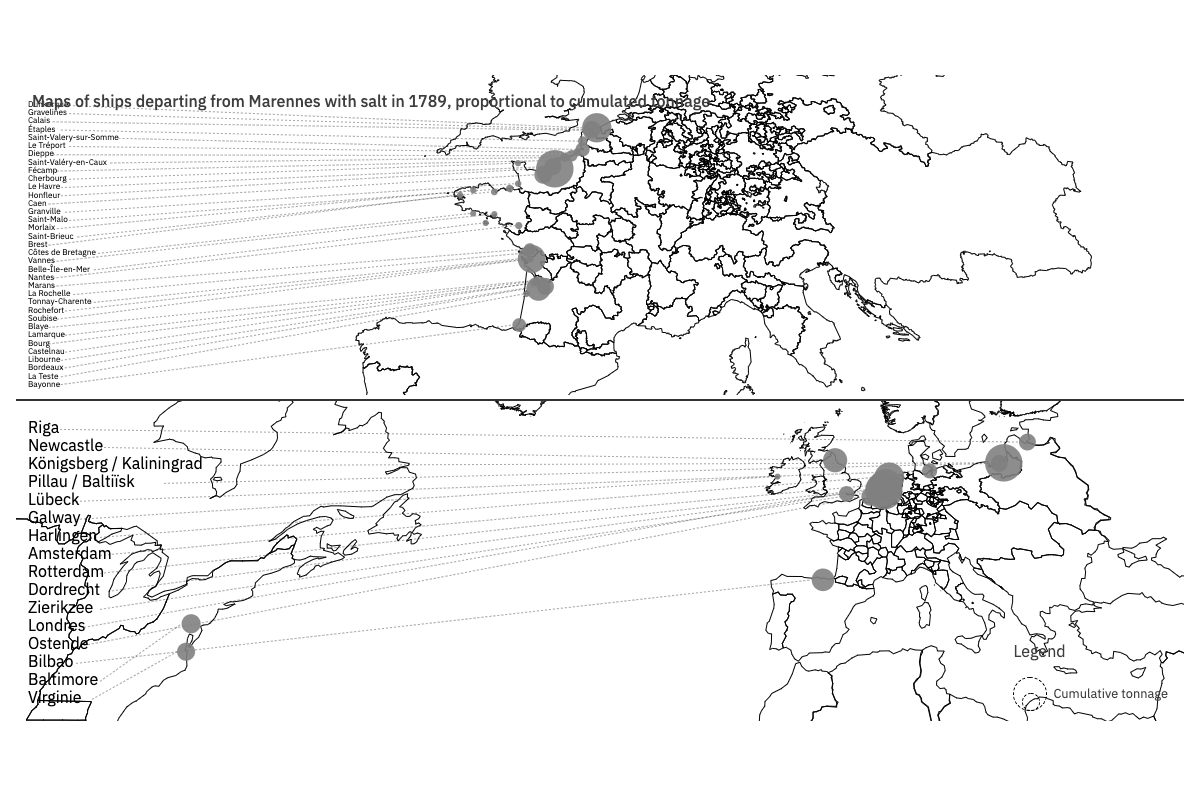
Maps of ships leaving Marennes with salt in 1789, sized by cumulative tonnage
La Rochelle, a dominating port but not a regional hub
How were the data and visualization produced ?
Le fond de carte des visualisations a été constitué en agrégeant de multiples sources et en les mettant en cohérence avec des méthodes de géomatique.
Les données de la base Navigocorpus sont utilisées pour toutes les parties liées à la navigation.
La première partie est constituée à partir des congés délivrés aux navires sortant d'un port (pointcalls) de la région étudiée en 1789, puis transcrite à travers des objets graphiques dont la hauteur et la largeur représente respectivement le tonnage moyen (jauge) des navires parti du port, et le nombre total de sorties, permettant de distinguer différents types de ports dans la région.
La seconde partie (graphes) est fondée sur les flux présents dans la base Navigocorpus pour l'année 1787 (la complétude des données de 1789 n'étant pas suffisante pour effectuer des comparaisons valides). À partir des flux enregistrés dans les ports, nous avons isolé trois corpus: les ports de l'amirauté de Bordeaux, ceux de l'amirauté de Nantes, et celui des trois amirautés de La Rochelle, Marennes et Les Sables-d'Olonne, correspondants à la région Poitou-Aunis-Saintonge objet de notre étude de cas. Après expérimentation, cette différence (une versus trois amirautés) n'occasionne pas de changement important dans les visualisations et les métriques. Nous avons ensuite regroupé pour chaque corpus les voyages par ports.
Les nœuds affichés sur la visualisation représentent donc un port, et les liens un ou plusieurs voyages réalisés entre deux ports en 1787. La taille des nœuds correspond à leur degré dans le réseau, c'est-à-dire dans ce cas au nombre de ports avec lesquels ils ont été mis en relation par des voyages en 1787.
La troisième partie de la visualisation mélange des données de Navigocorpus et de Toflit18.
Pour ce qui est des objets visuels de la carte, les portions de cercle sont tirés des états d'export enregistrés dans Toflit18, divisés suivant l'origine des produits commercés (dans la région ou hors de la région) et agrégés par leur valeur commerciale en livres tournois. Les triangles correspondent aux états de sortie de port enregistrés dans Navigocorpus, divisés suivant la destination des navires (dans la région ou hors de la région) et agrégés par part du tonnage cumulé des navires partis des ports rattachés à chaque bureau de ferme. En cliquant sur les objets visuels des bureaux des fermes, on obtient une visualisation du détail des ports pour chaque bureau : ces derniers sont dimensionnés en deux classes de taille (plus ou moins de mille tonneaux cumulés pour 1789), et les triangles sont également proportionnés en fonction de la part des voyages vers l’extérieur de la région PASA.
Dans l'encart intitulé "Comparaison avec les bureaux de fermes et ports dominants d'autres directions en 1787", les objets visuels permettant de faire la comparaison sont similaires à deux nuances près : ils sont construits avec les données de la Ferme générale de 1787, et les données de navigation concernent le port dominant de chaque direction des fermes, et non l'ensemble des ports.
How to read the visualization?
The top part of the chart displays the differences between the PASA region ports according to varying triangle dimensions: the wider the top of the triangle, the more ships departed from the port in 1789; the higher the triangle, the higher their average tonnage. The tonnage is expressed in tonneaux (1 tx is approximately 1.44 cubic meters). By hovering over a port, the data relevant to the port is displayed. A fairly clear difference can be observed between ports restricted to local navigation (small number of departures and small average tonnage) and the major ports of the region (high number of departures and high tonnage).
The second chart shows the network of flows in three Amirautés (La Rochelle, Bordeaux, and Nantes). The size of the points represents the number of journeys. The color indicates whether the ports belong to the Amirauté (green) or not (orange). The name of each port appears when you click on the point. The "Charente" point corresponds to the "Tonnay-Charente" port. The La Rochelle Amirauté clearly has many important ports connected to each other and to the outside. Bordeaux and Nantes dominate their Amirauté much more clearly and account for a greater share of external flows.
The weakness of the port of La Rochelle is confirmed in the third chart, which shows how central each port was within its Amirauté. The two measures proposed (PageRank and betweenness centrality) do not give exactly the same results. “Betweenness centrality” counts the number of shortest routes between two ports passing through a given port; “PageRank” measures the connection with other well-connected ports (see https://en.wikipedia.org/wiki/Centralit %C3%A9). Both show that La Rochelle was less central.
The last chart shows the low centrality of La Rochelle. Its customs office exported almost no products from the PASA region (green part of the circle). The other six customs offices exported regional products. La Rochelle also exported somewhat less to destinations outside its customs region than Les Sables-d'Olonne, Saint-Martin-de-Ré, or Marennes (size of orange triangles compared to green triangles). The other dominant ports (Bordeaux and Nantes) exported more products from their region to the outside and were more outward-looking in terms of navigation.
When hovering over the dots (or their content), detailed information appears on the proportion of the data represented. By clicking on each of the seven customs offices, the detailed tonnage shipped to and from the ports attached to it appears. This tonnage was aggregated inside the dots and indicates the regional typology of the exported products.