Visualizations atlas
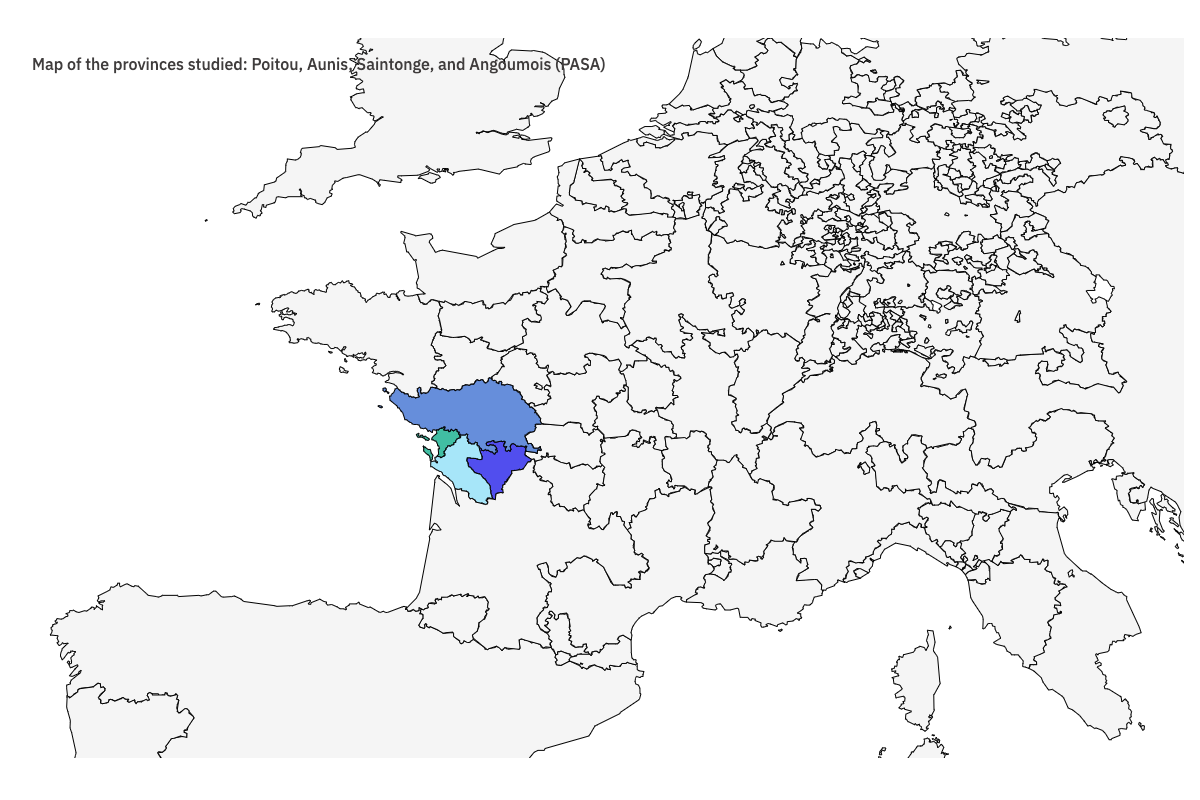
Map of the provinces investigated : Poitou, Aunis, Saintonge, Angoumois (PASA)
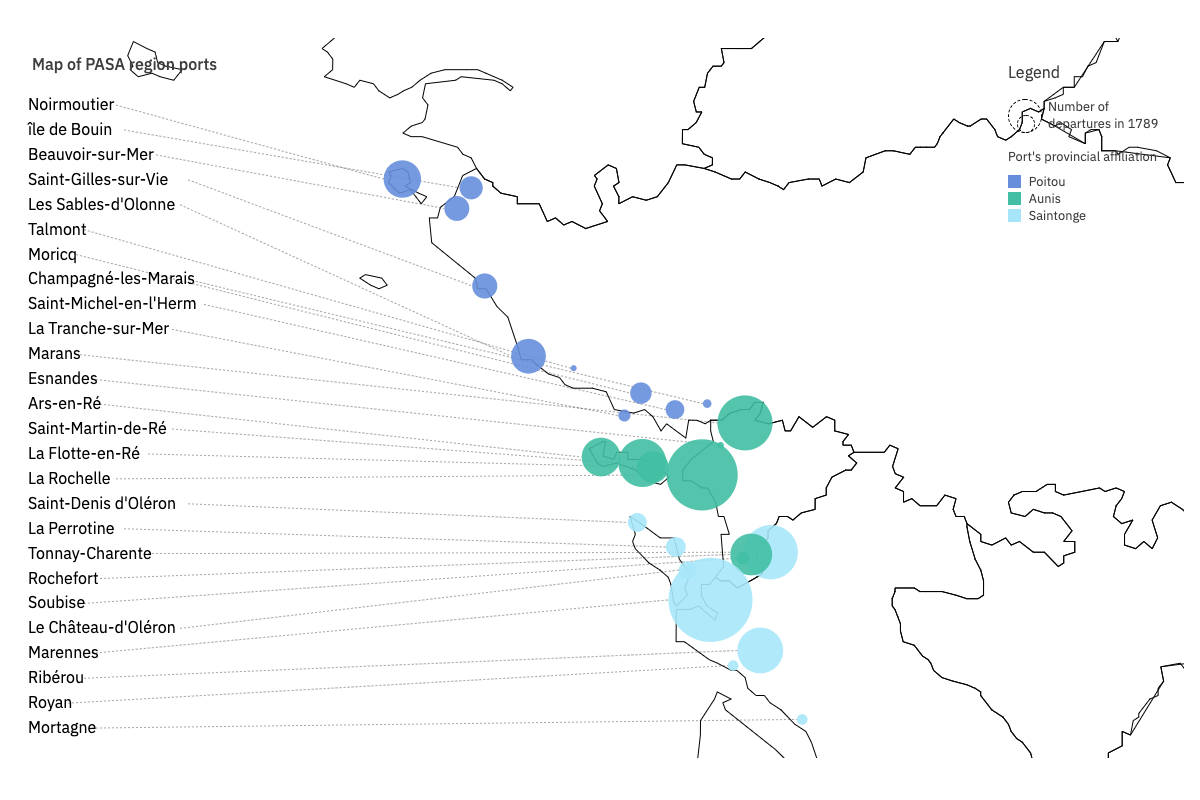
Map of PASA region ports
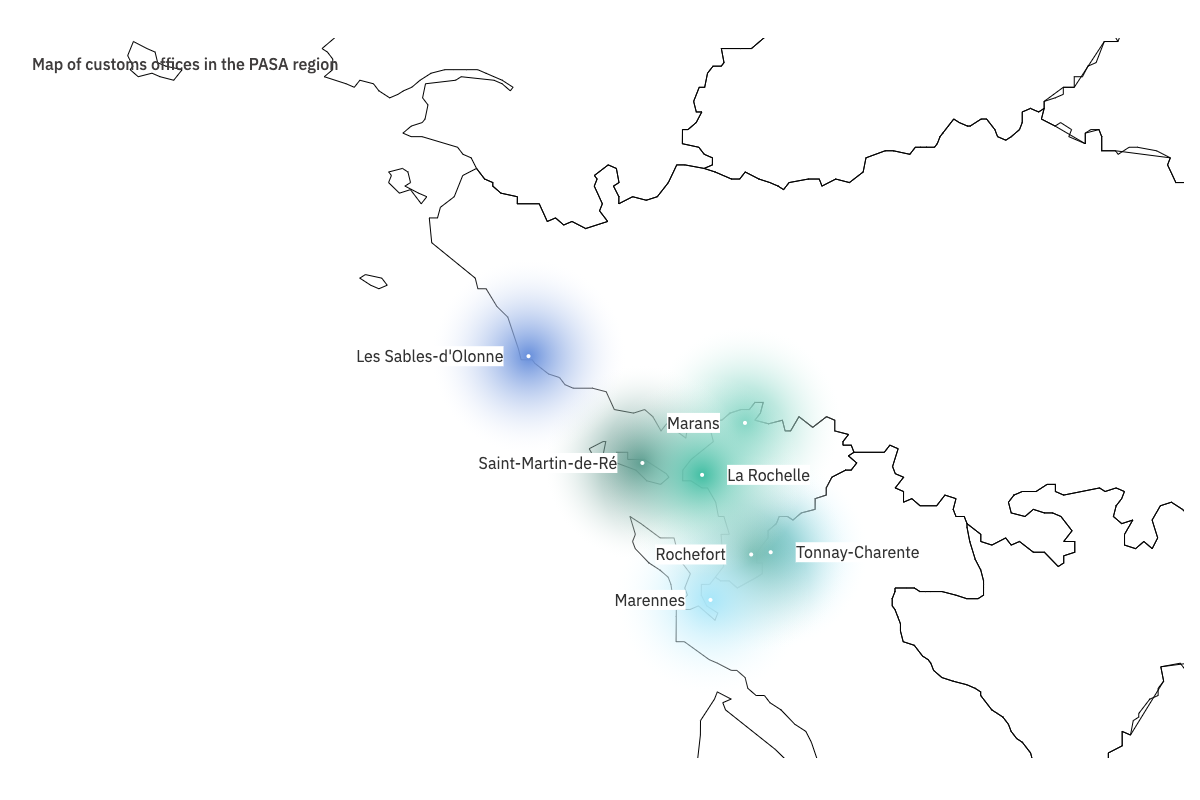
Map of customs offices in the PASA region
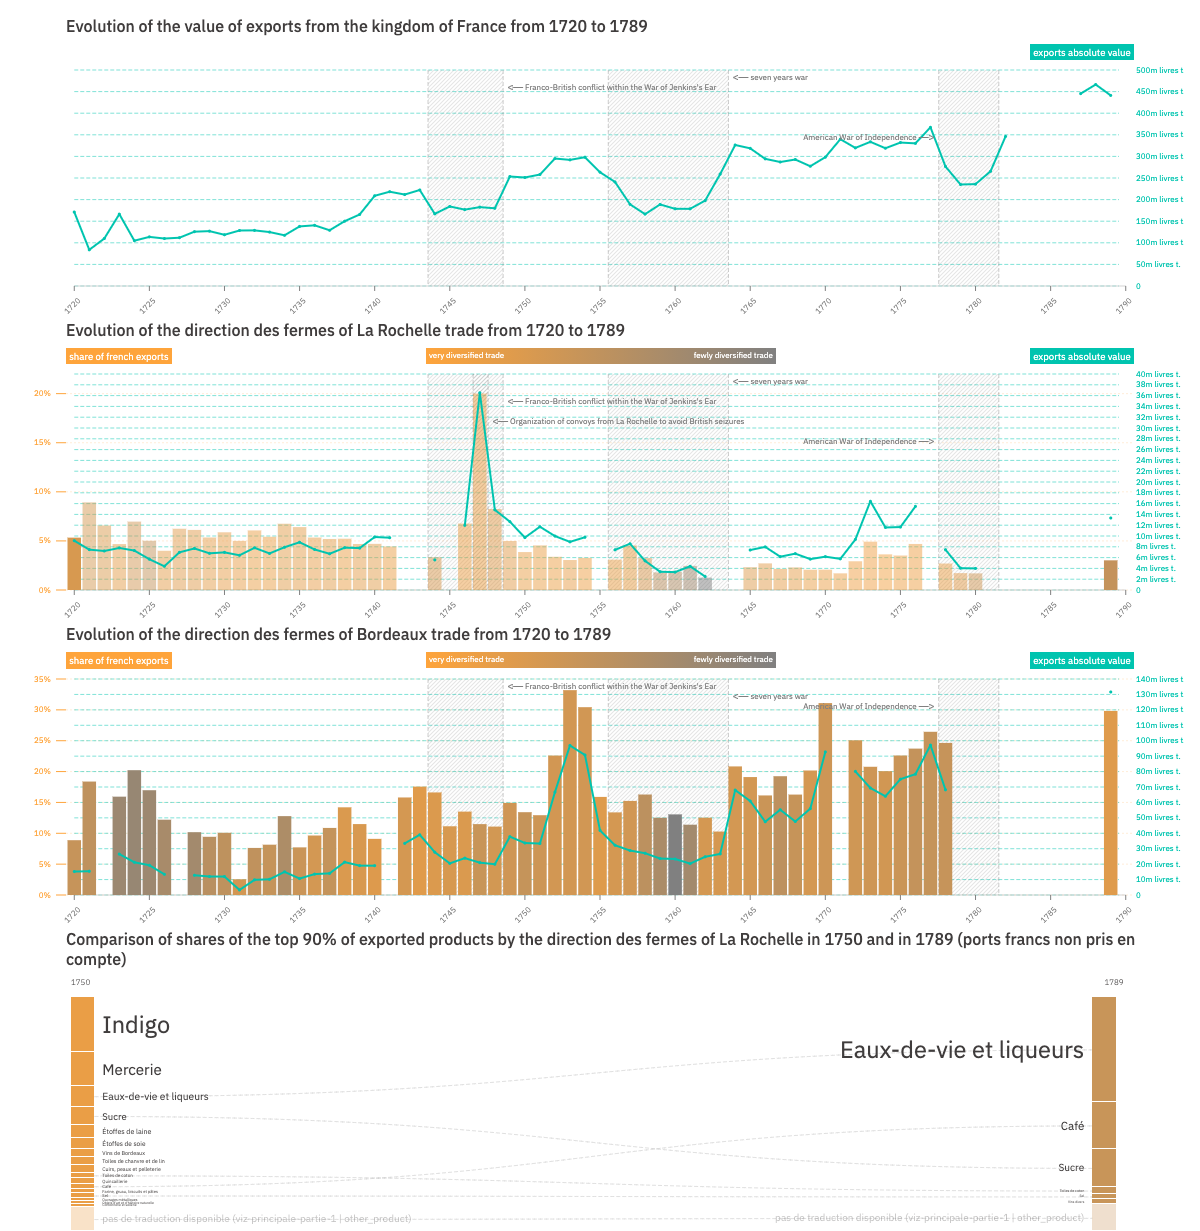
The decline of the La Rochelle region following the loss of Canada
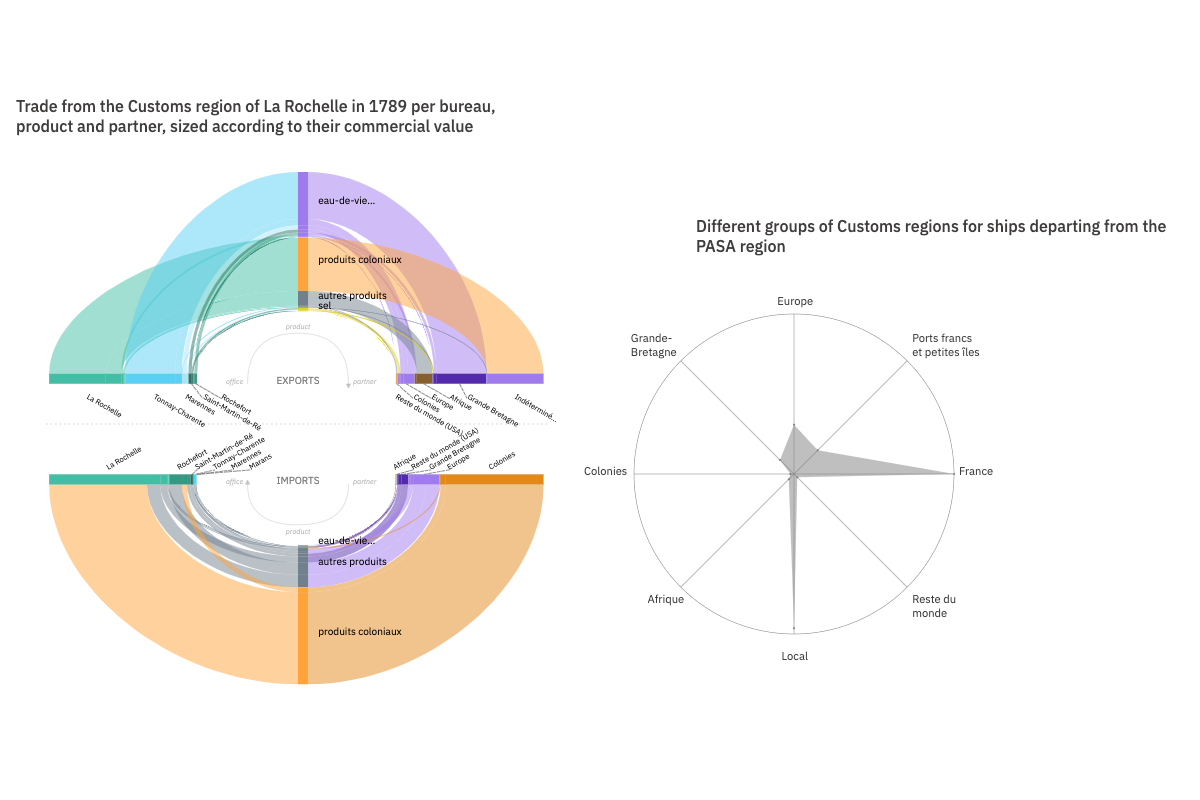
Highly specialized ports: the slave trade, the salt trade, and the brandy trade
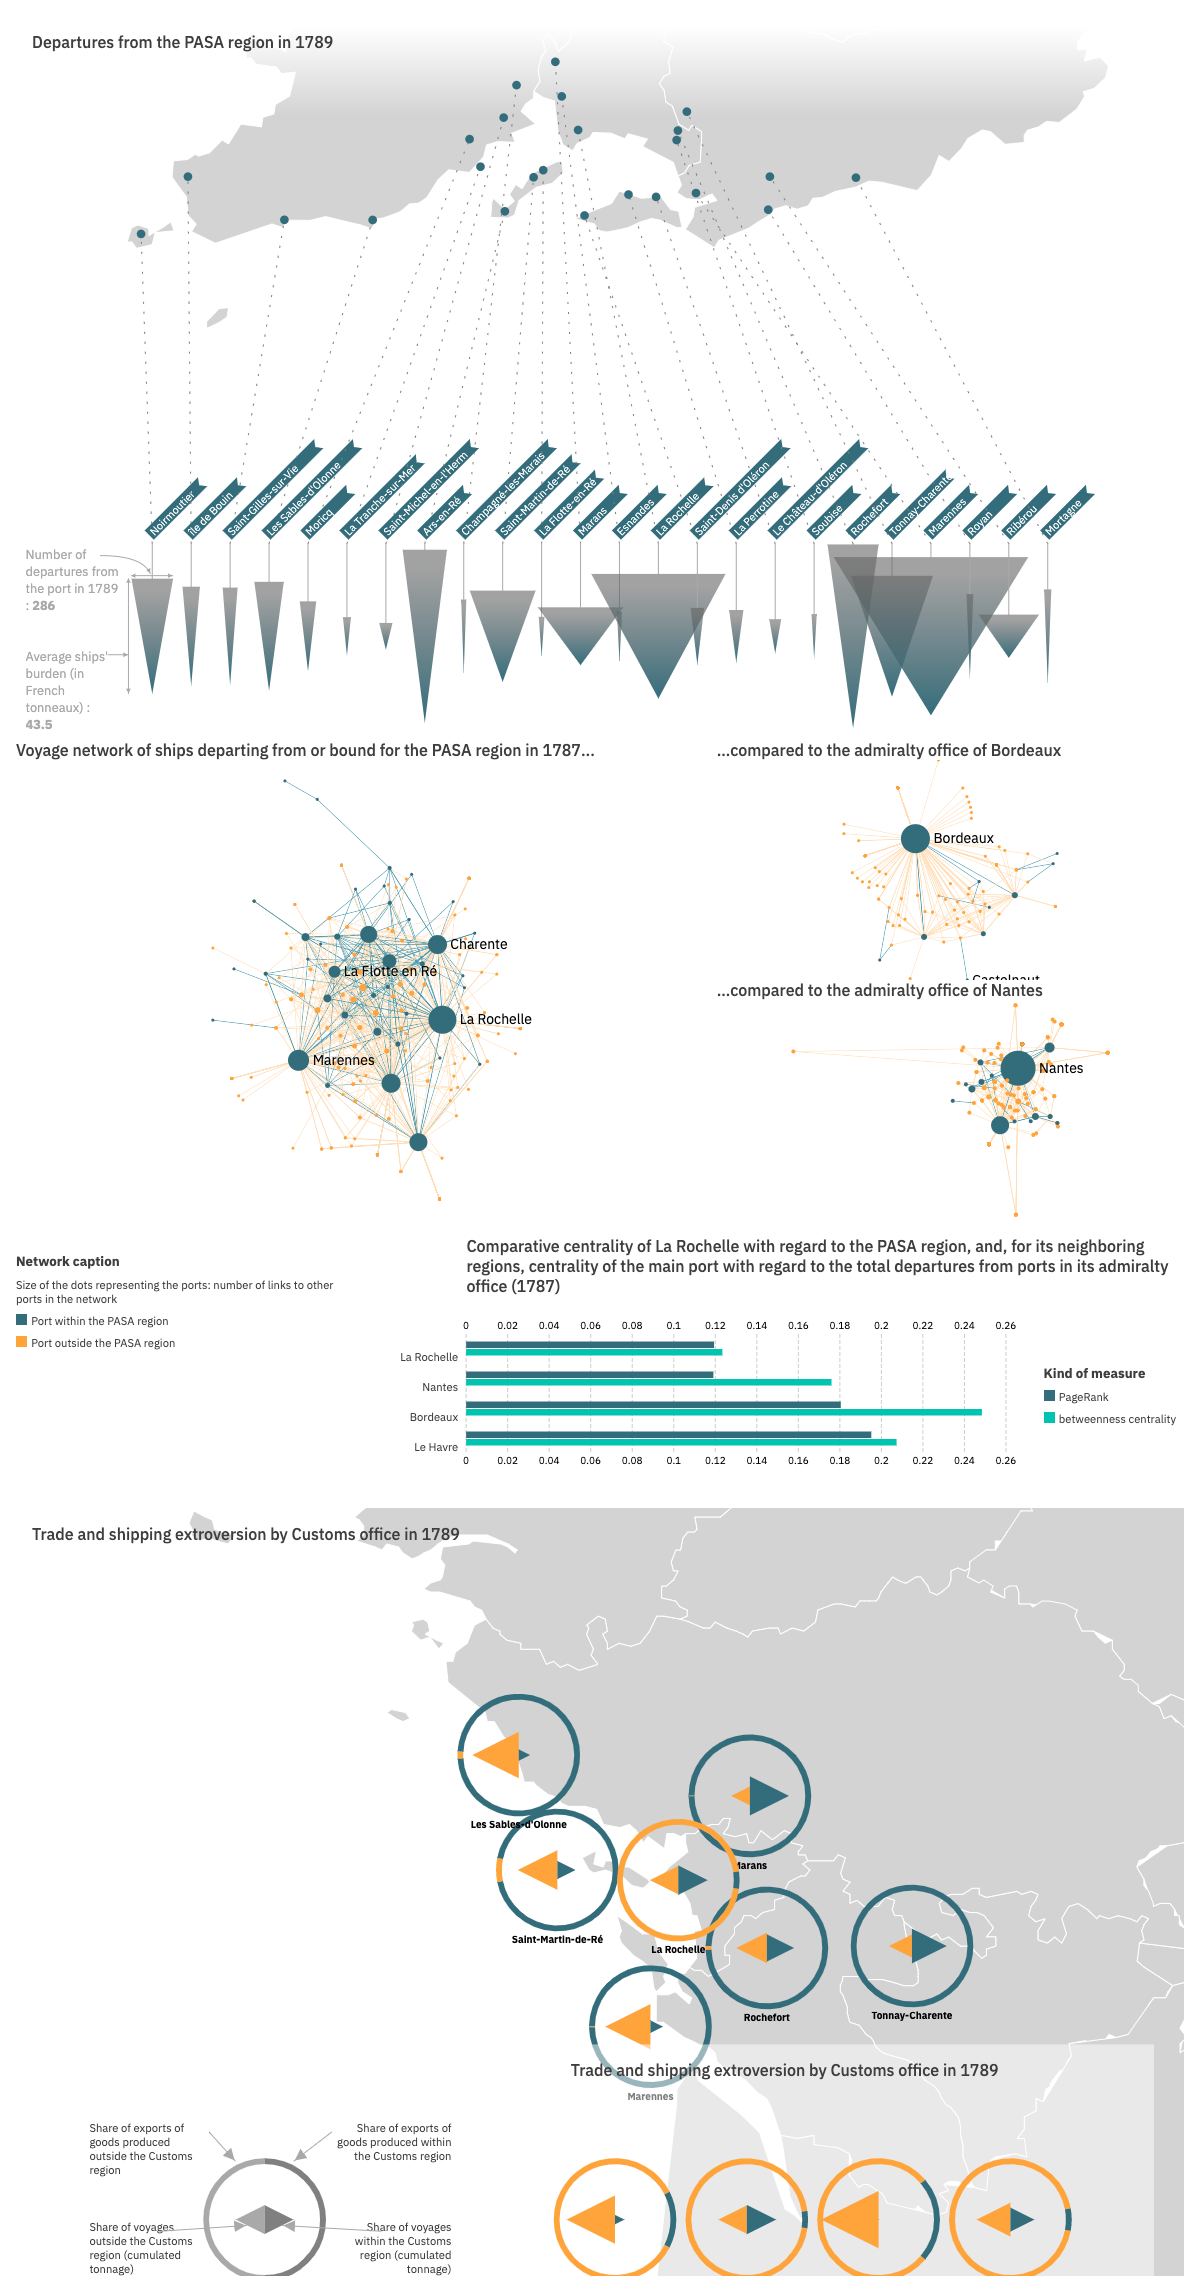
La Rochelle, a dominating port but not a regional hub
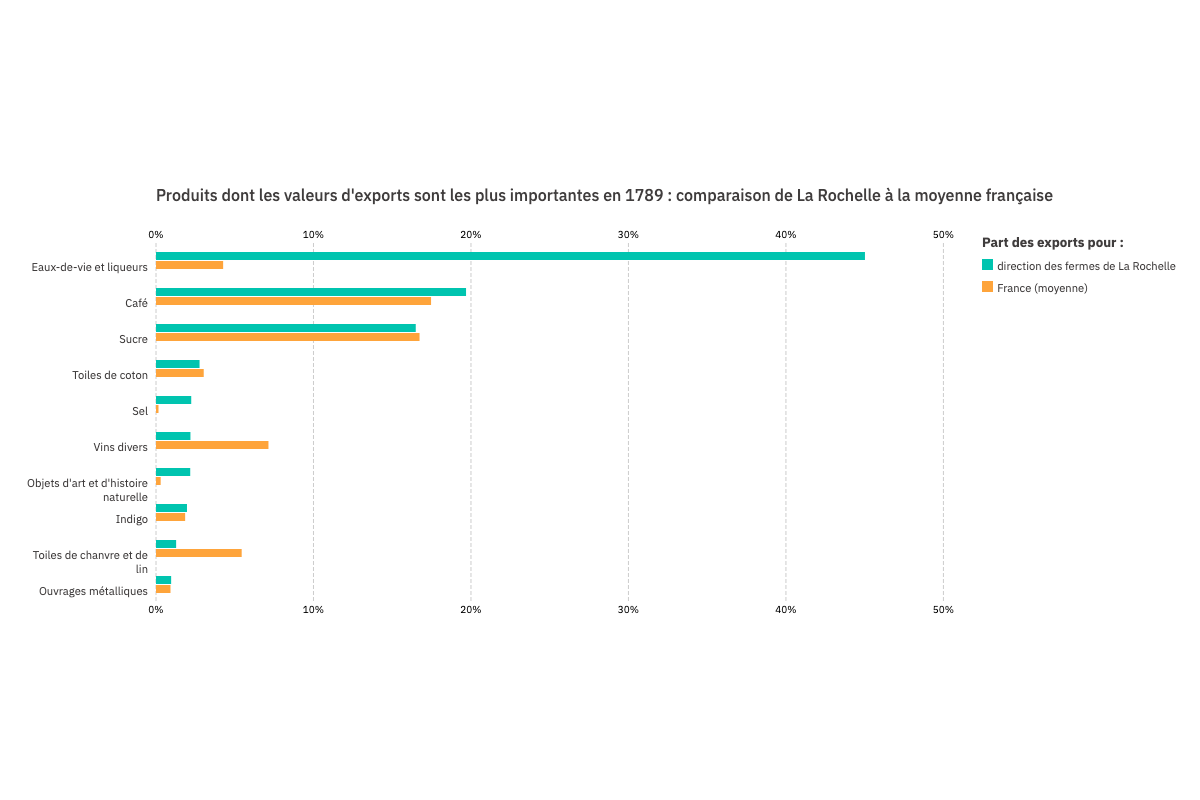
Products with the highest export value in 1789: comparison between the La Rochelle customs region and the French average
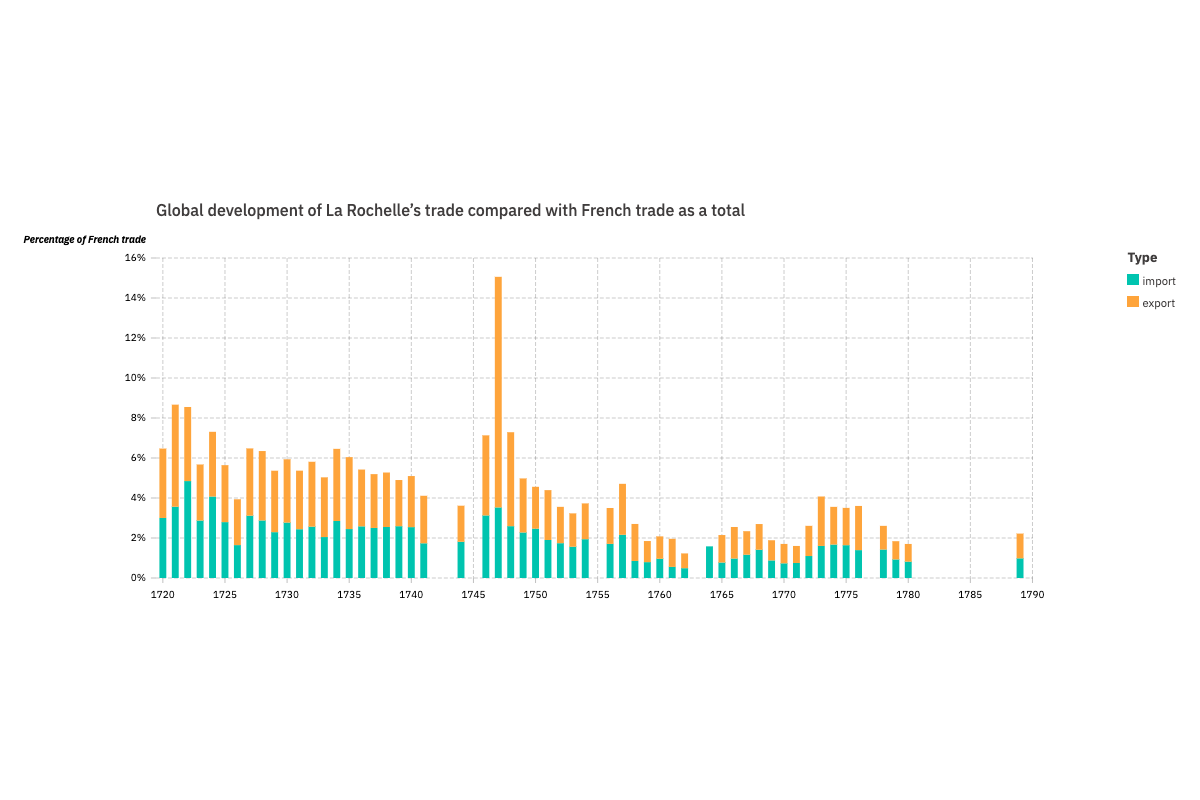
Evolution of the share of La Rochelle trade in relation to France as a whole
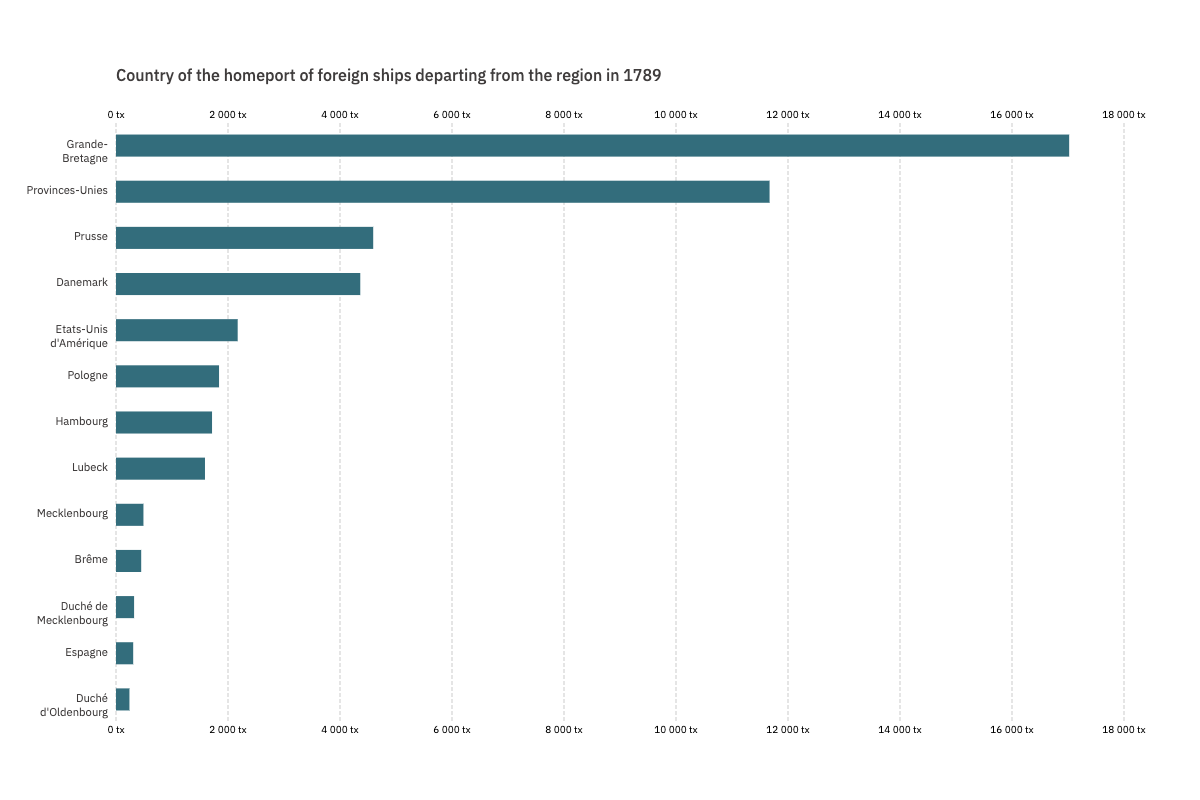
Home country of ships departing from the region in 1789
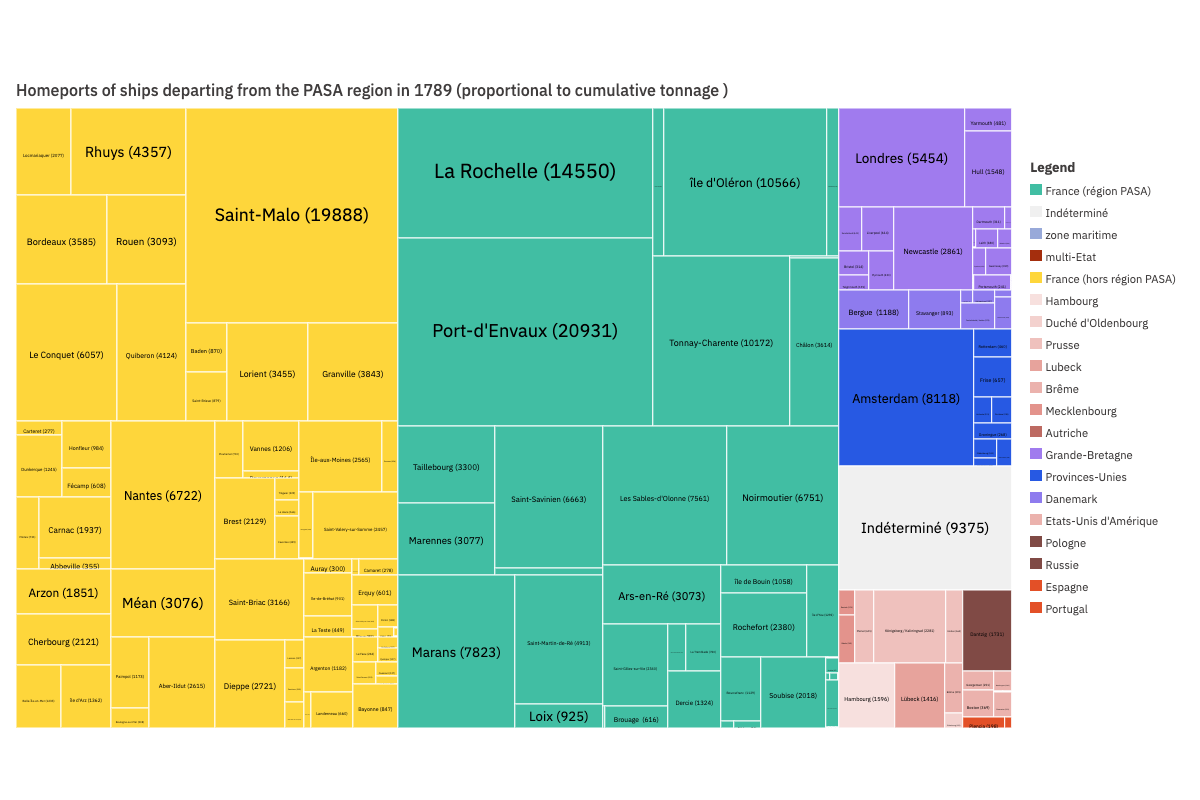
Home ports of ships departing from the PASA region in 1789
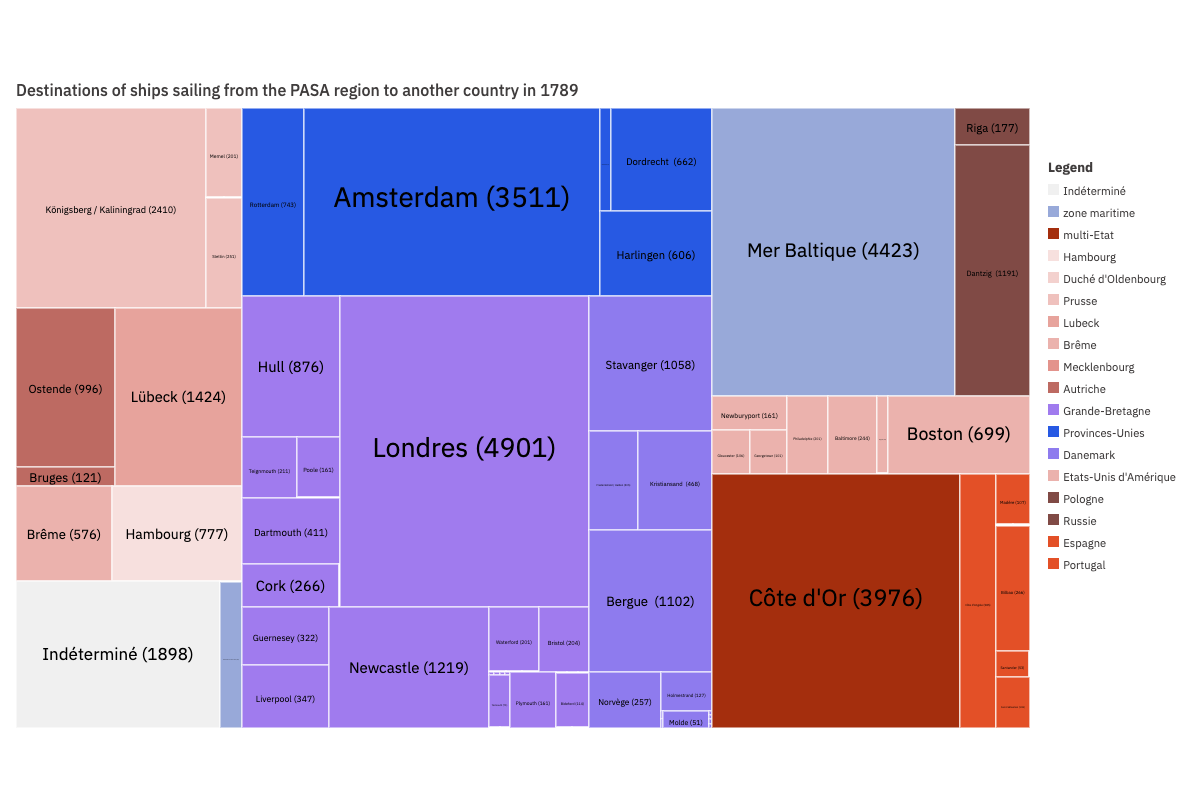
Destinations of ships sailing from the PASA region to another country in 1789
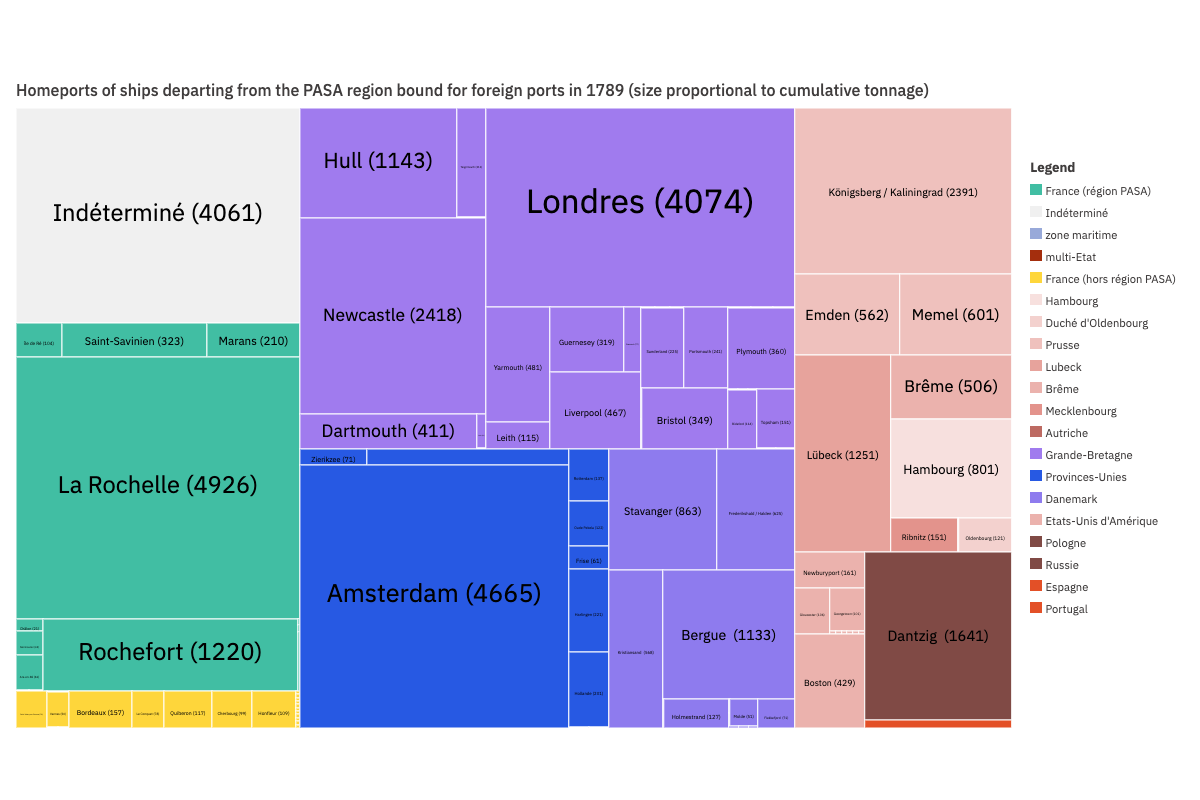
Home port of ships sailing to another country in 1789
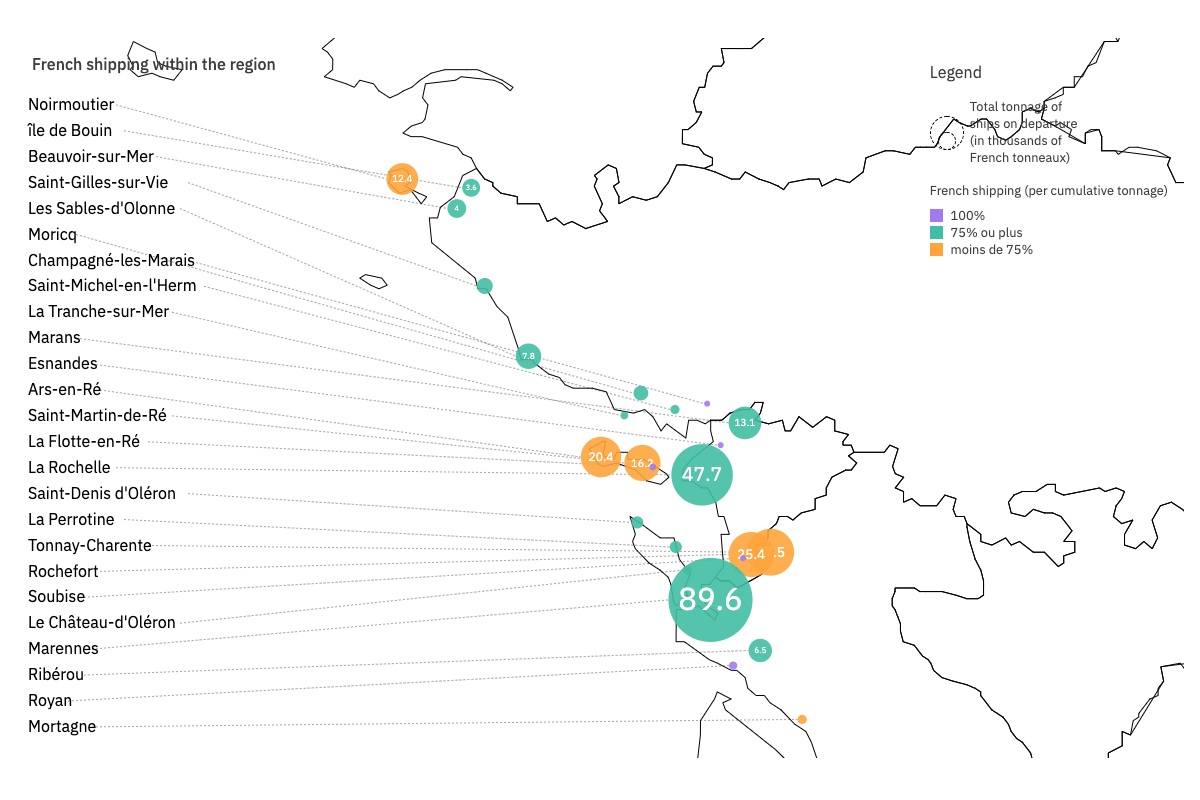
Share of French navigation in the region
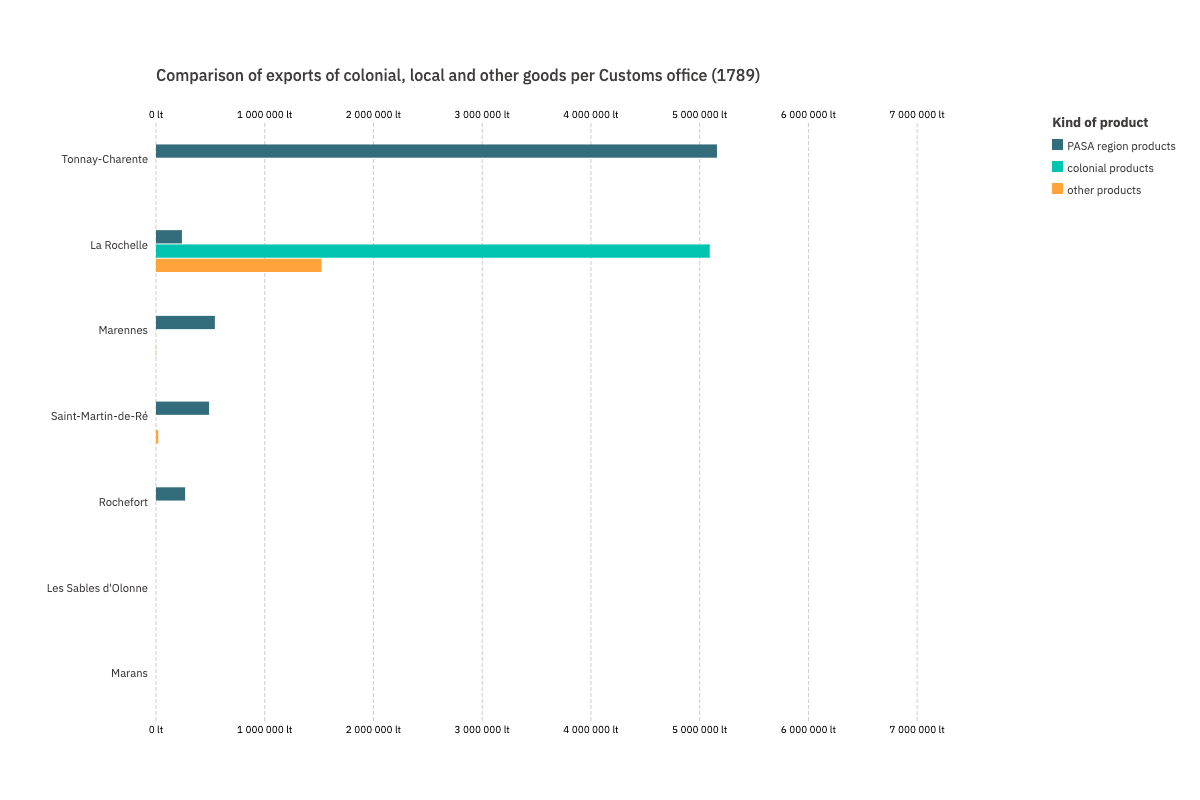
Comparison of colonial, local, and other exports by customs office
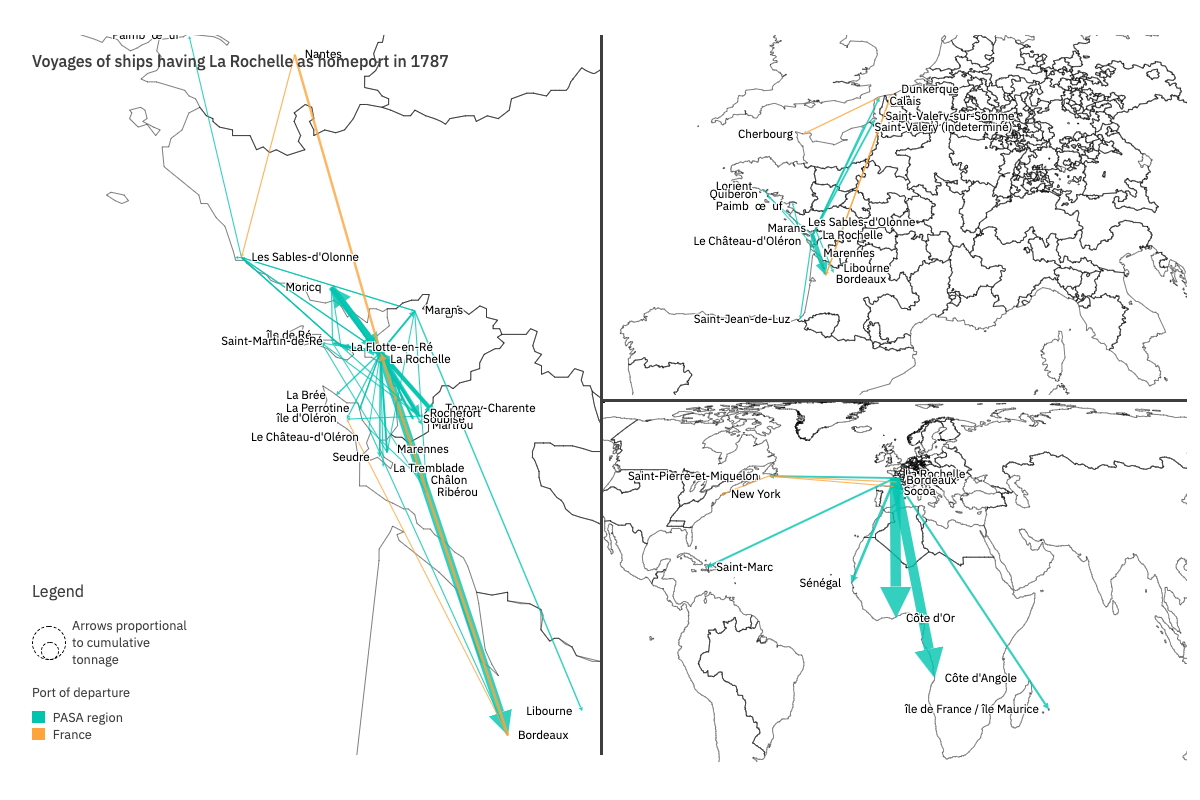
Flows of ships outfitted by the port of La Rochelle in 1787
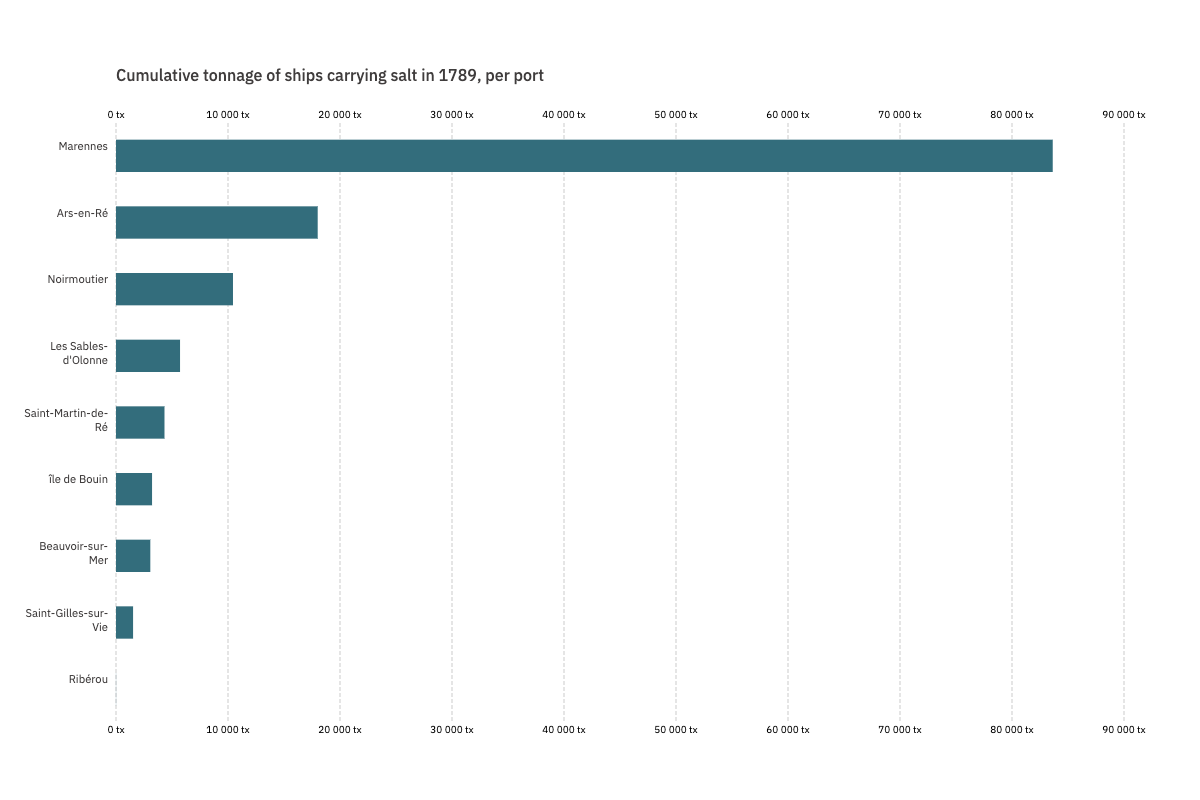
Ports of departure of vessels transporting salt in 1789 from the PASA region, aggregated by cumulative tonnage
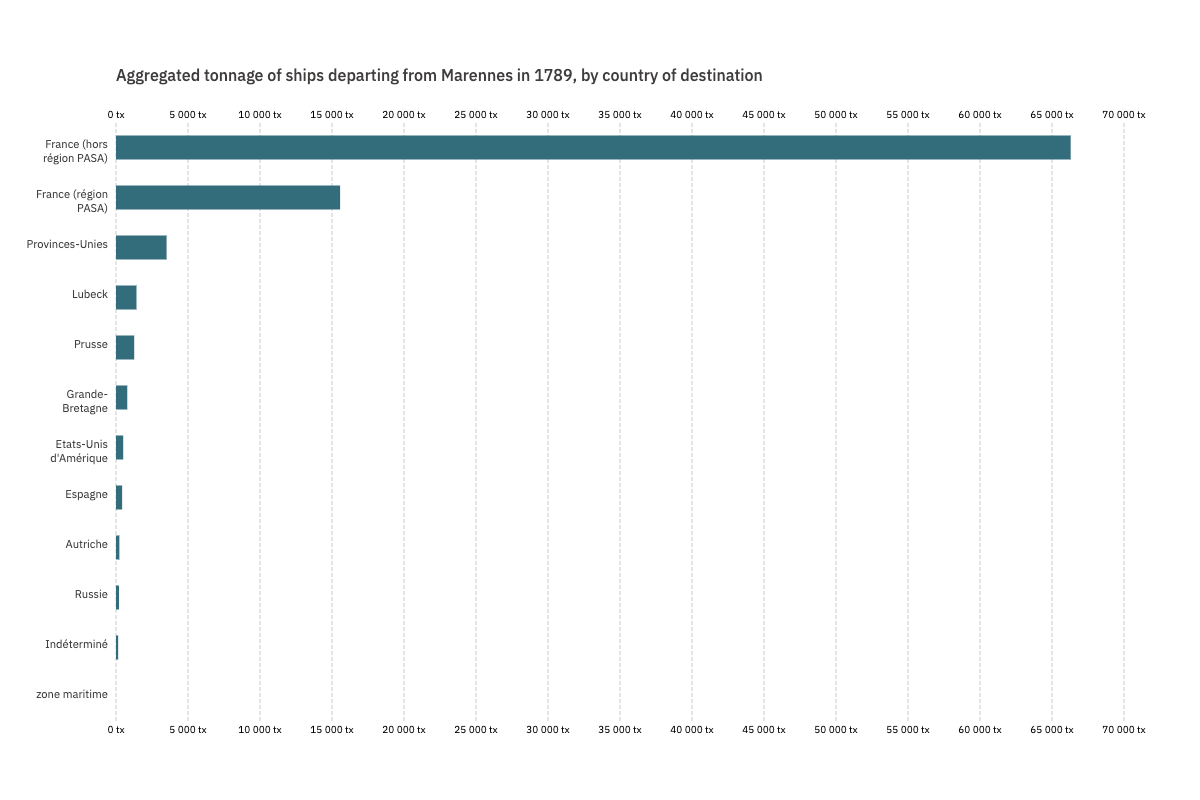
Destination of ships departing from Marennes in 1789, aggregated by country and by cumulative tonnage
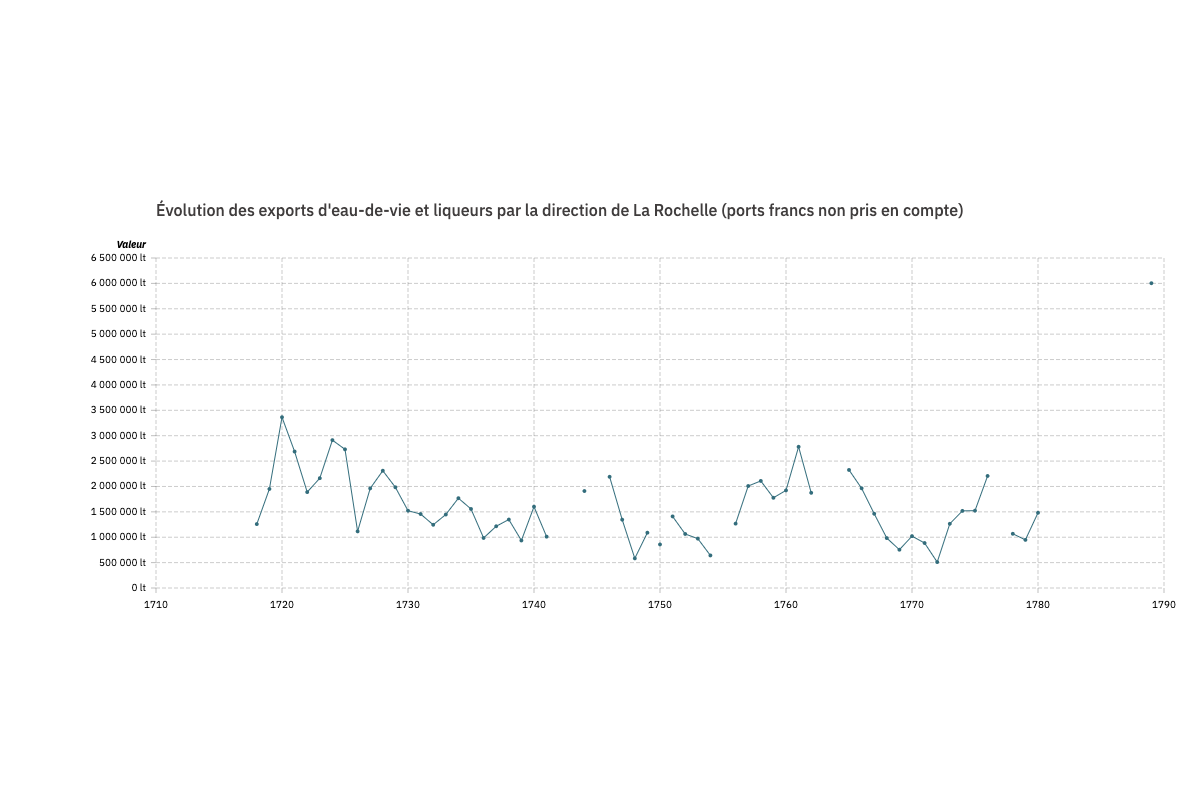
Evolution of brandy exports from the La Rochelle customs region (free ports not included)
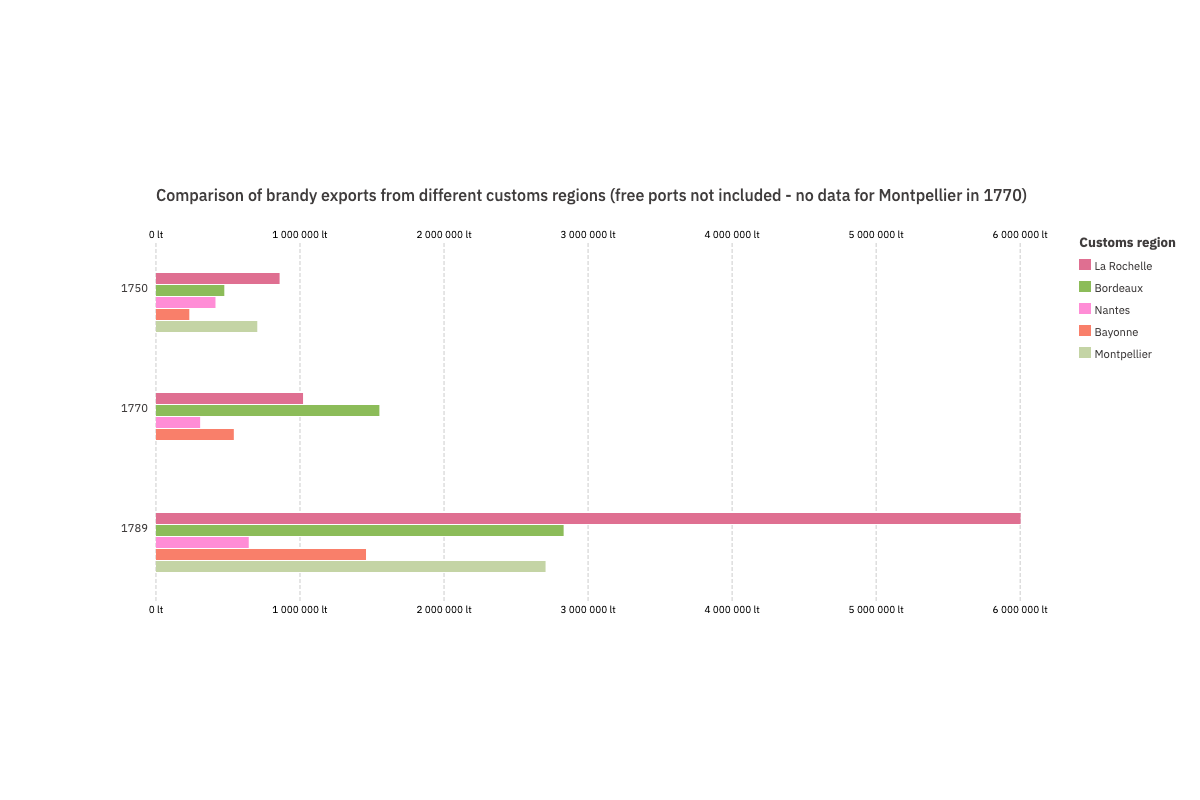
Comparison of brandy exports from different customs regions (free ports not included - no data for Montpellier in 1770)
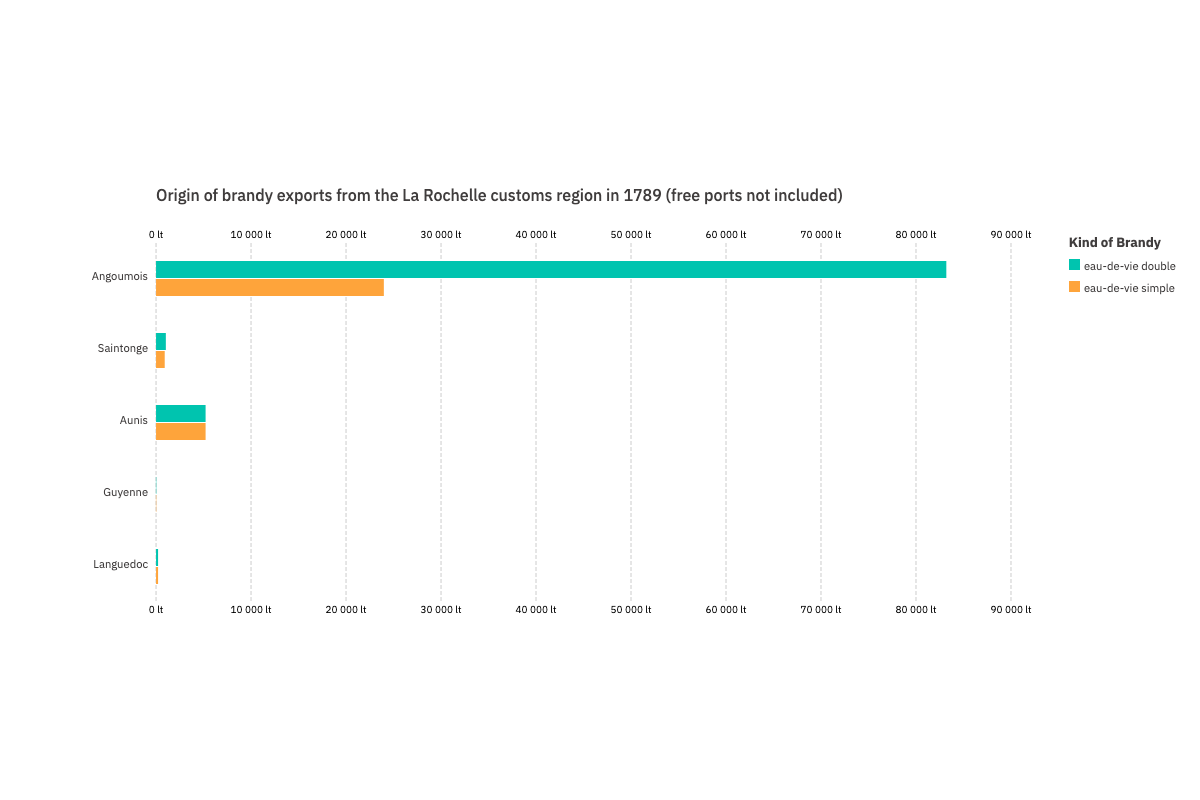
Origin of brandy exports from the La Rochelle customs region in 1789 (free ports not included)
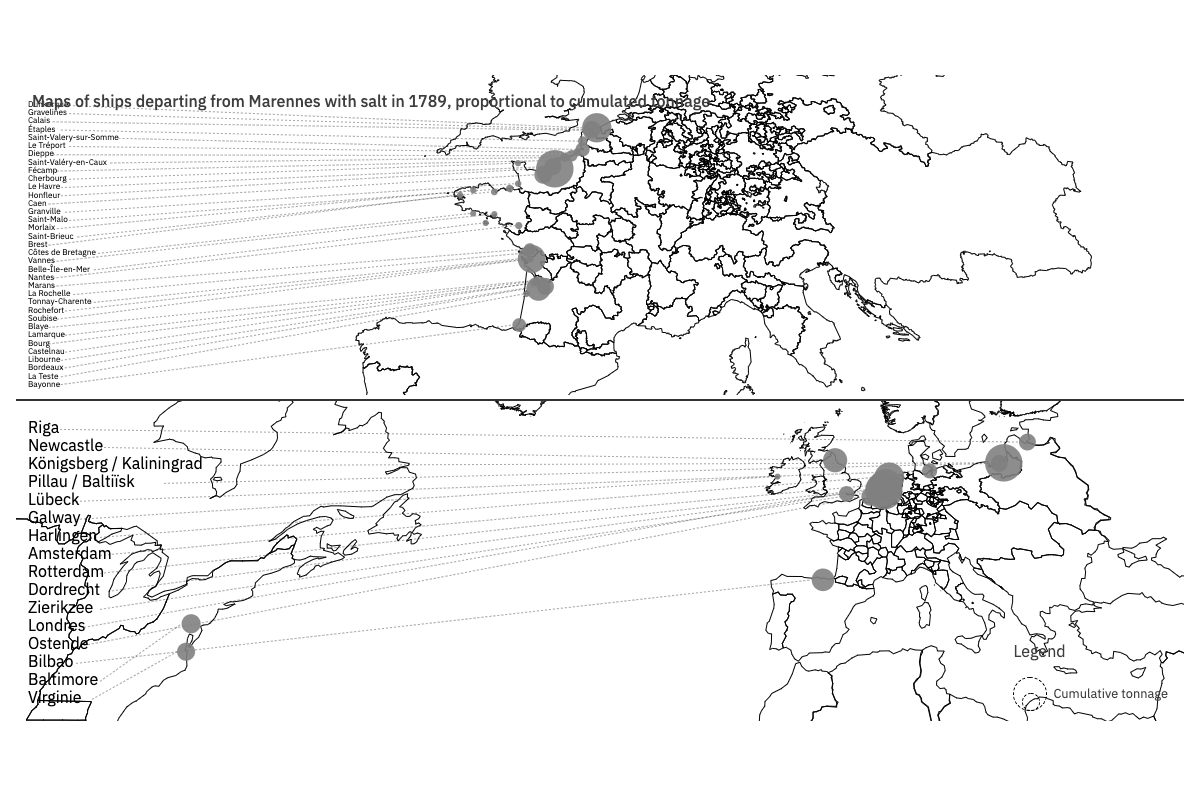
Maps of ships leaving Marennes with salt in 1789, sized by cumulative tonnage
The decline of the La Rochelle region following the loss of Canada
How were the data and visualization produced ?
Data was drawn from the Toflit18 database, and more particularly from the flows in its "Best Guess customs region prod x partner" group of sources which provides information by customs region (rather than all of France). For each part of the visual, only exports were taken into account. <br> The diversity of trade in the region was calculated using the Herfindahl-Hirschmann index, i.e., the sum of the square of French market shares by class of exported product (based on the Toflit18 classification "Revolution & Empire", shown in the detail of the third part). Gaps in online visuals and histograms indicate years for which sources are missing.
How to read the visualization?
The top chart shows the evolution of French exports measured in livres. They clearly increased throughout the century. The negative effect of the maritime wars is shown.
The second chart shows the evolution of exports from the La Rochelle customs region measured in livres (in green). It also shows the share of La Rochelle in French exports (orange bars). The value of exports remained constant while the share of the La Rochelle customs region in French exports dropped. The peak of 1747 can be explained by the organization of convoys leaving La Rochelle that year.
The third chart shows the evolution of exports in livres from the Bordeaux customs region (in green). It also shows Bordeaux’s share of French exports (orange bars). The vitality of the Bordeaux customs region, in absolute terms and relative to France, contrasts with the absolute stability and relative decline of the La Rochelle customs region.
The bottom chart compares the products exported by La Rochelle in 1750 and 1789. The length of the "vertical bricks" and the font size represent the share of each product. Only products totaling at least 90% of exports are individualized. The trade of La Rochelle was much more diversified in 1750 than in 1789. Several important export products (indigo, haberdashery, wool, and silk fabrics, etc.) became marginal. <br>