Visualizations atlas
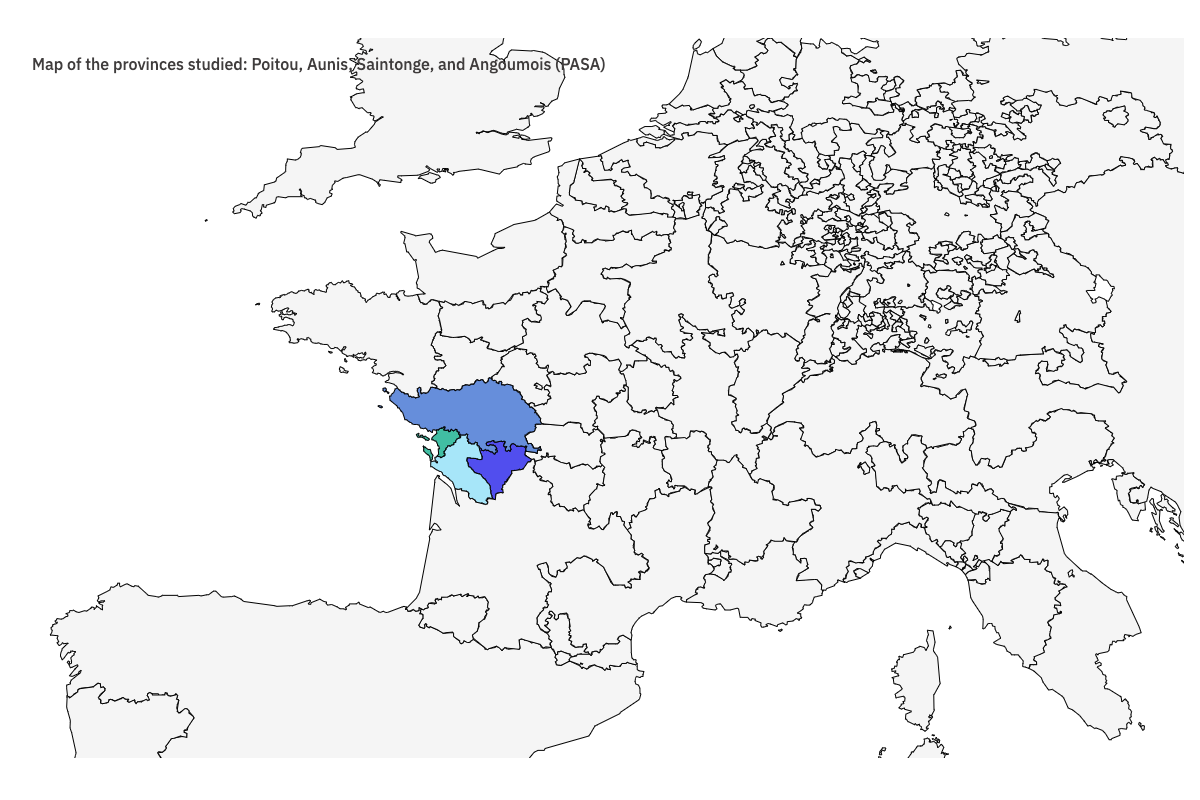
Map of the provinces investigated : Poitou, Aunis, Saintonge, Angoumois (PASA)
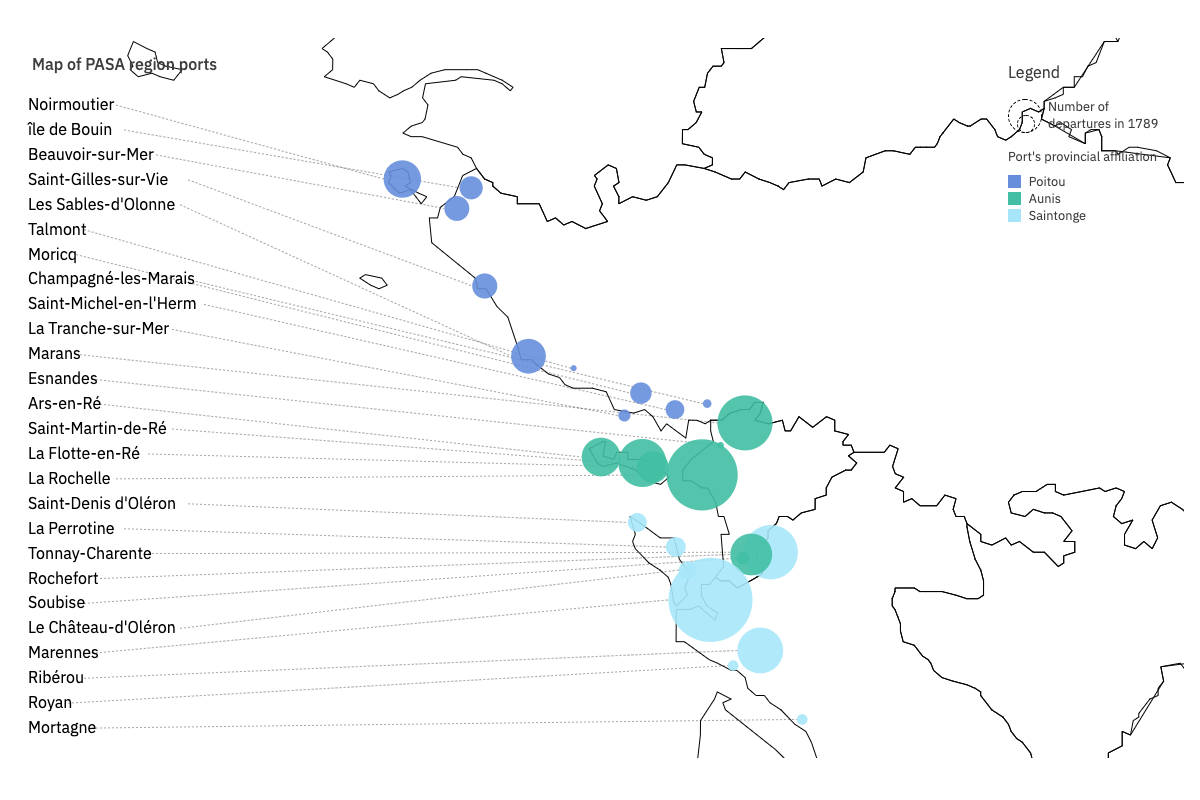
Map of PASA region ports
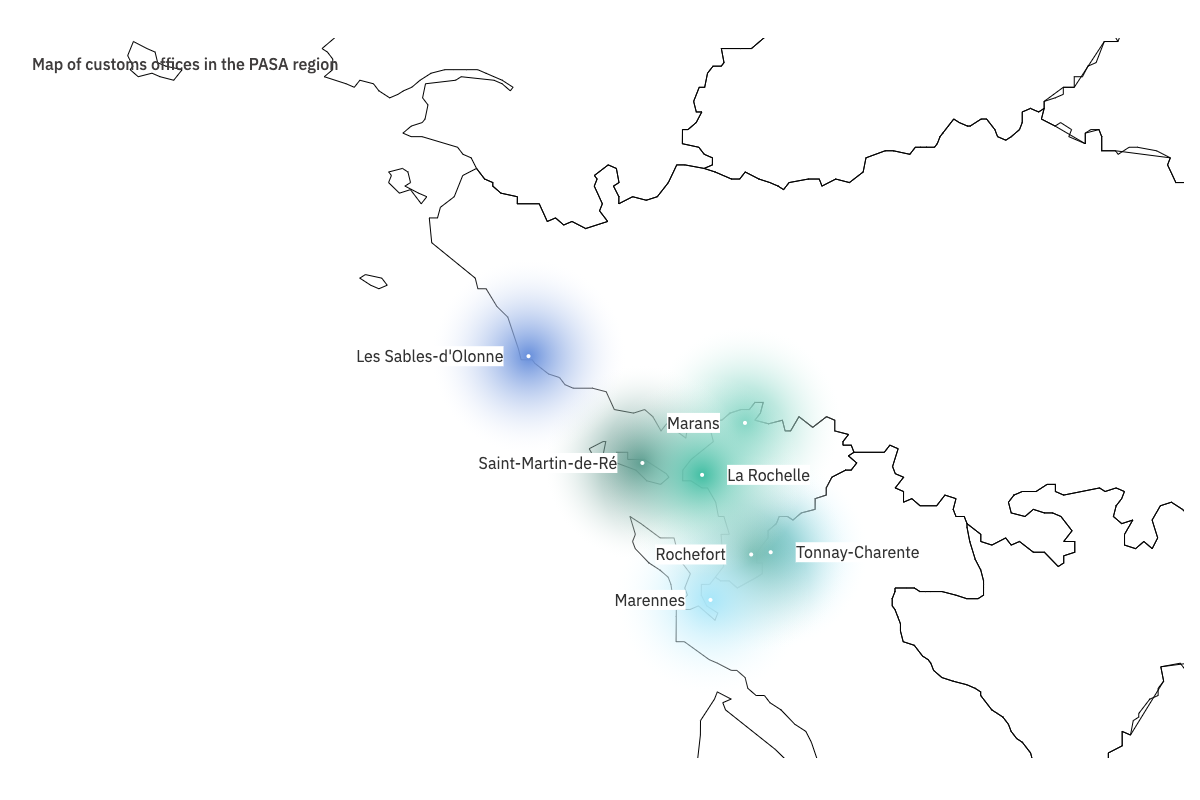
Map of customs offices in the PASA region
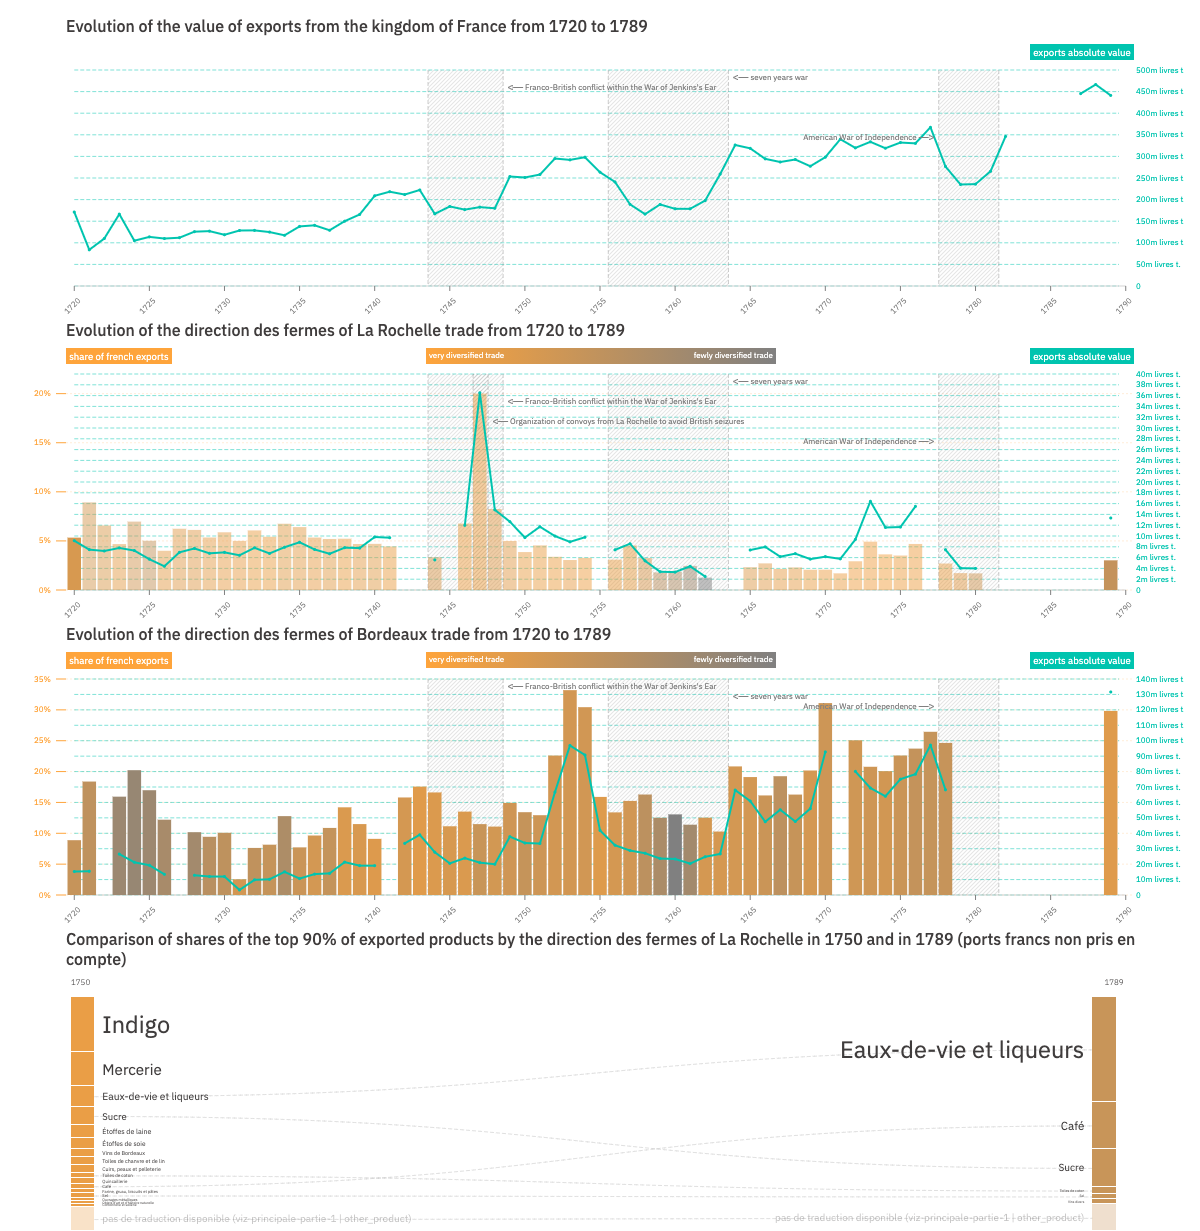
The decline of the La Rochelle region following the loss of Canada
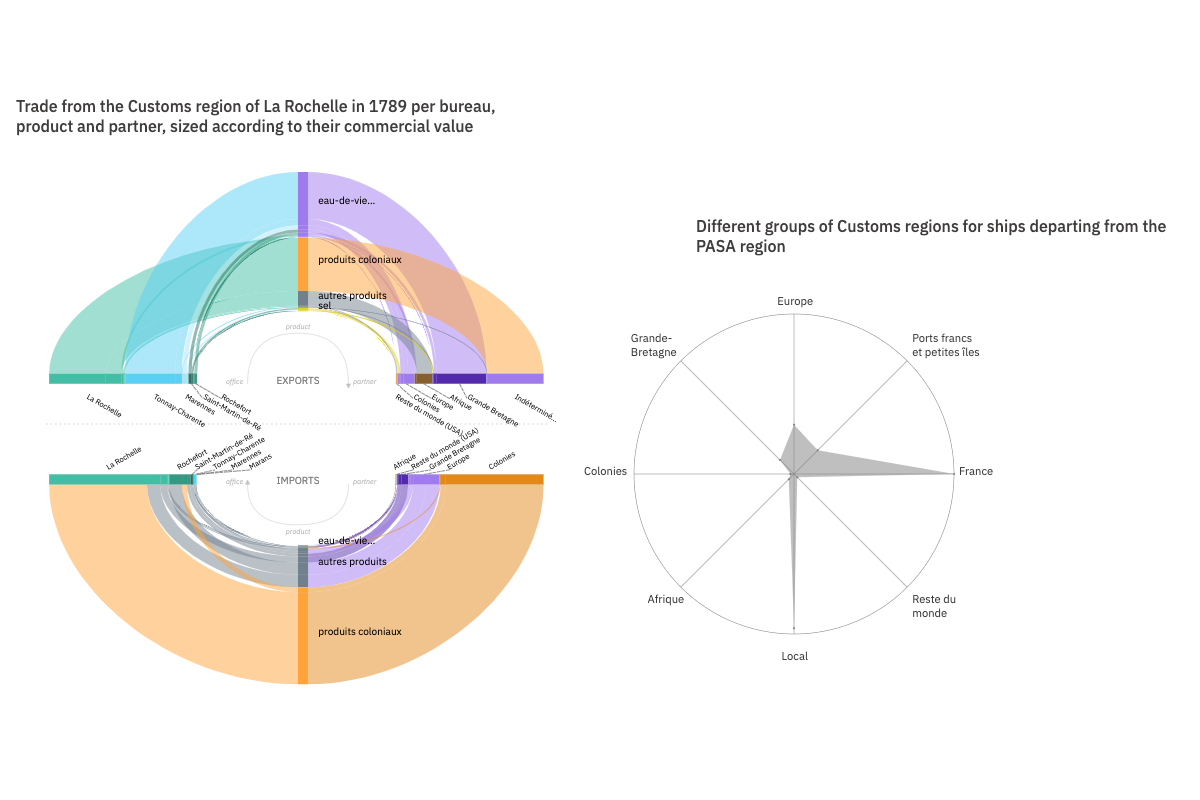
Highly specialized ports: the slave trade, the salt trade, and the brandy trade
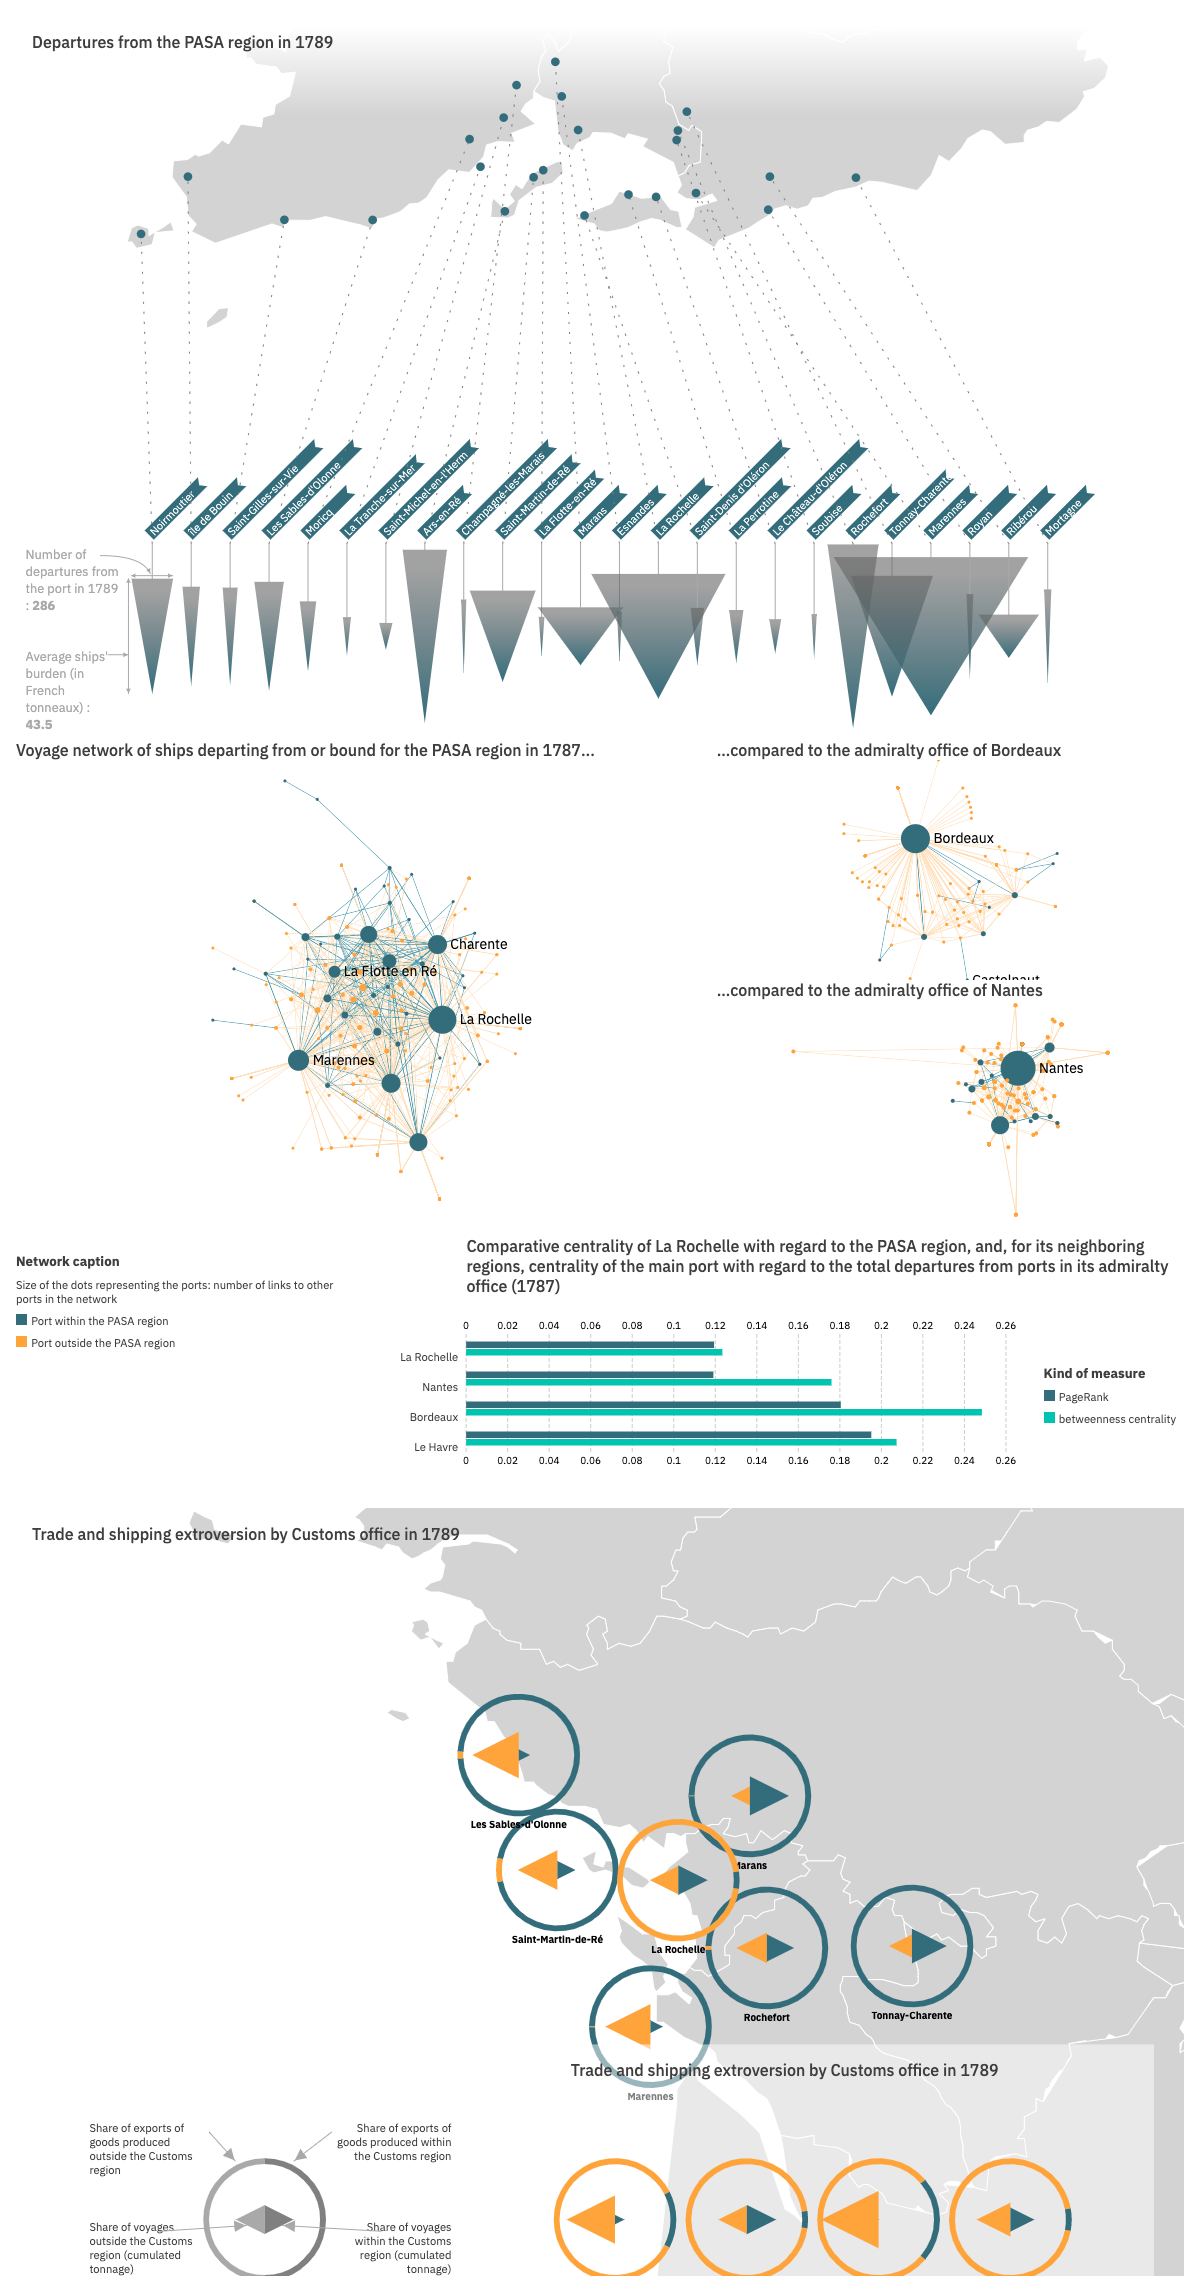
La Rochelle, a dominating port but not a regional hub
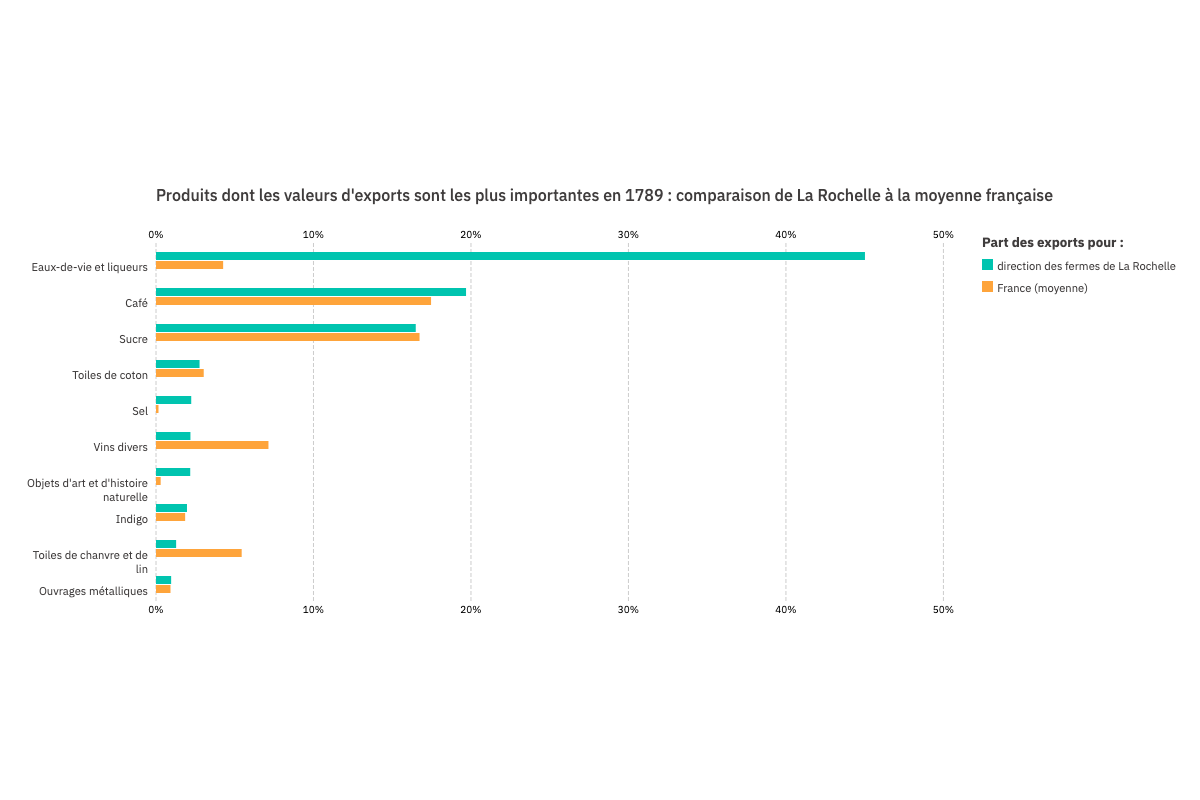
Products with the highest export value in 1789: comparison between the La Rochelle customs region and the French average
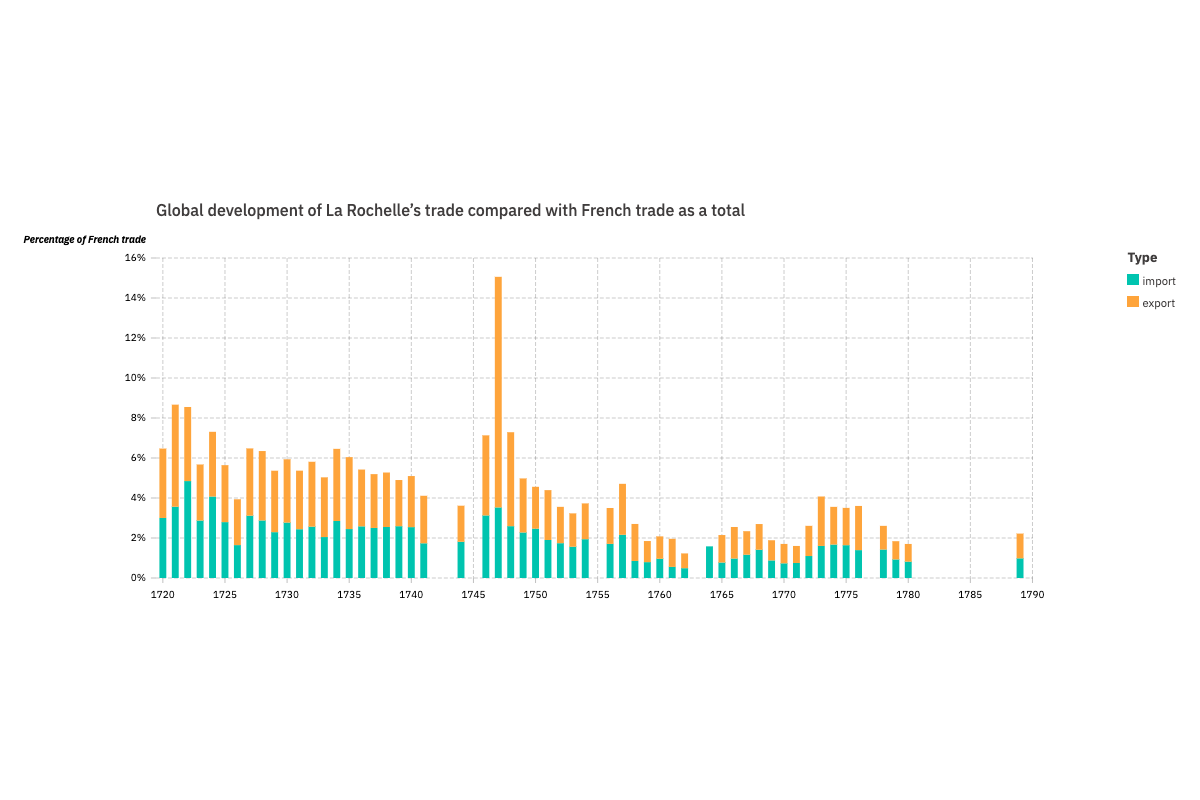
Evolution of the share of La Rochelle trade in relation to France as a whole
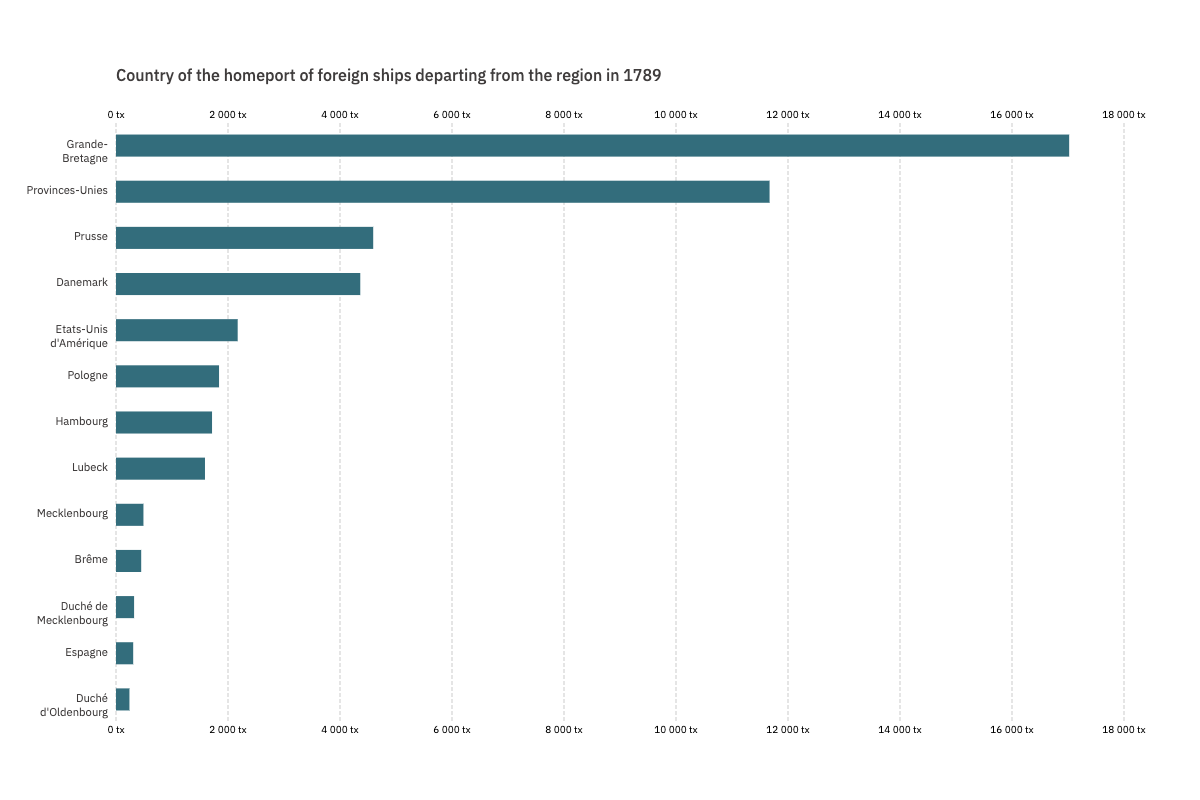
Home country of ships departing from the region in 1789
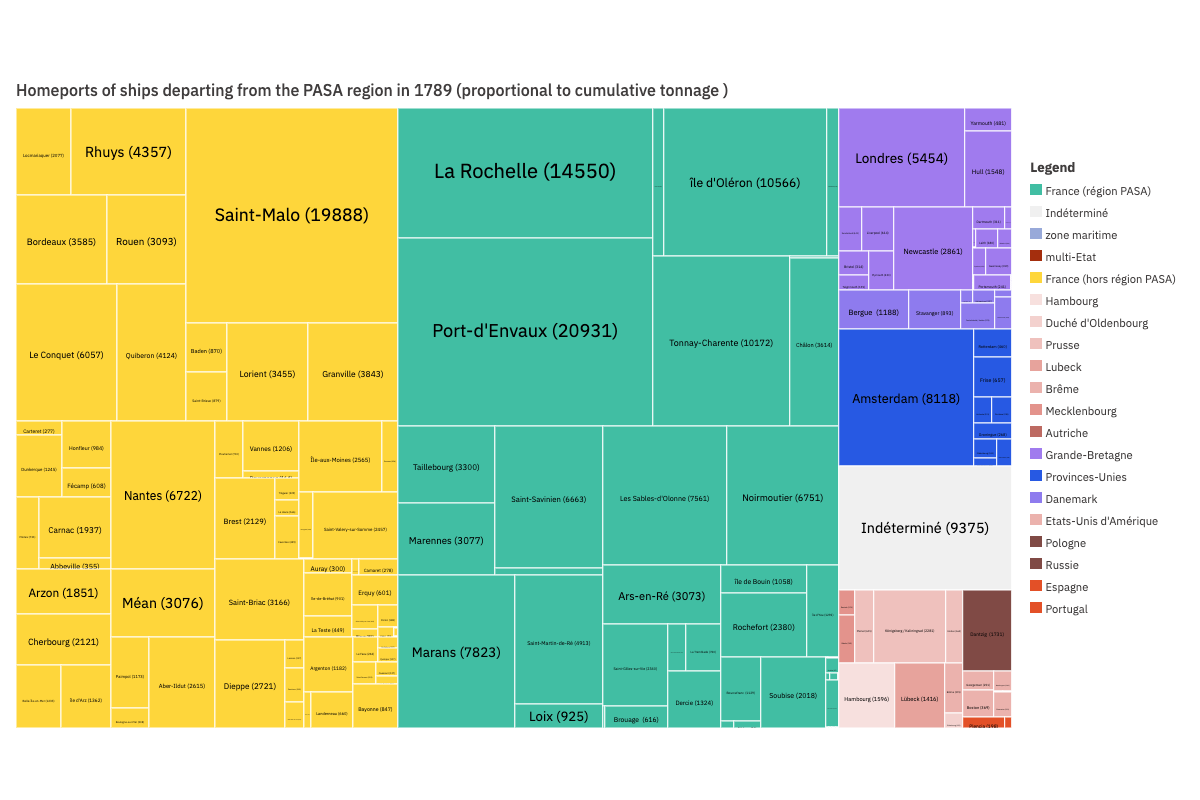
Home ports of ships departing from the PASA region in 1789
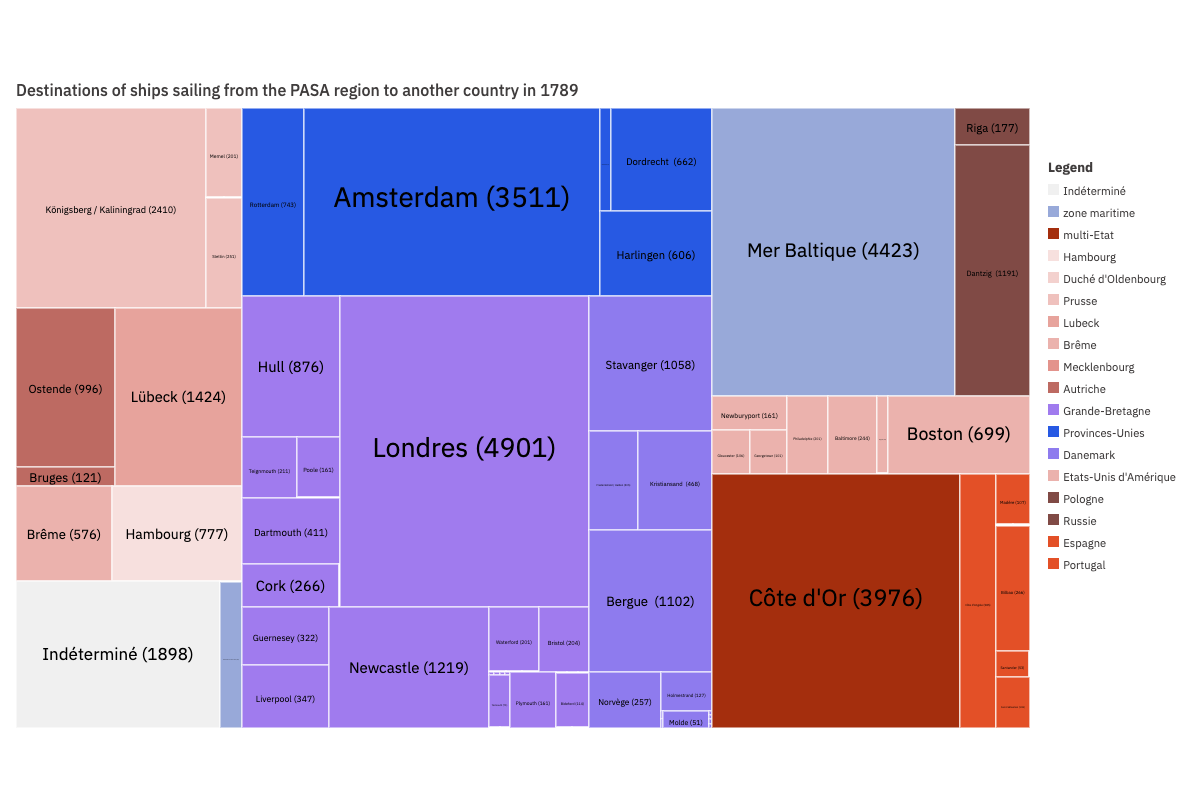
Destinations of ships sailing from the PASA region to another country in 1789
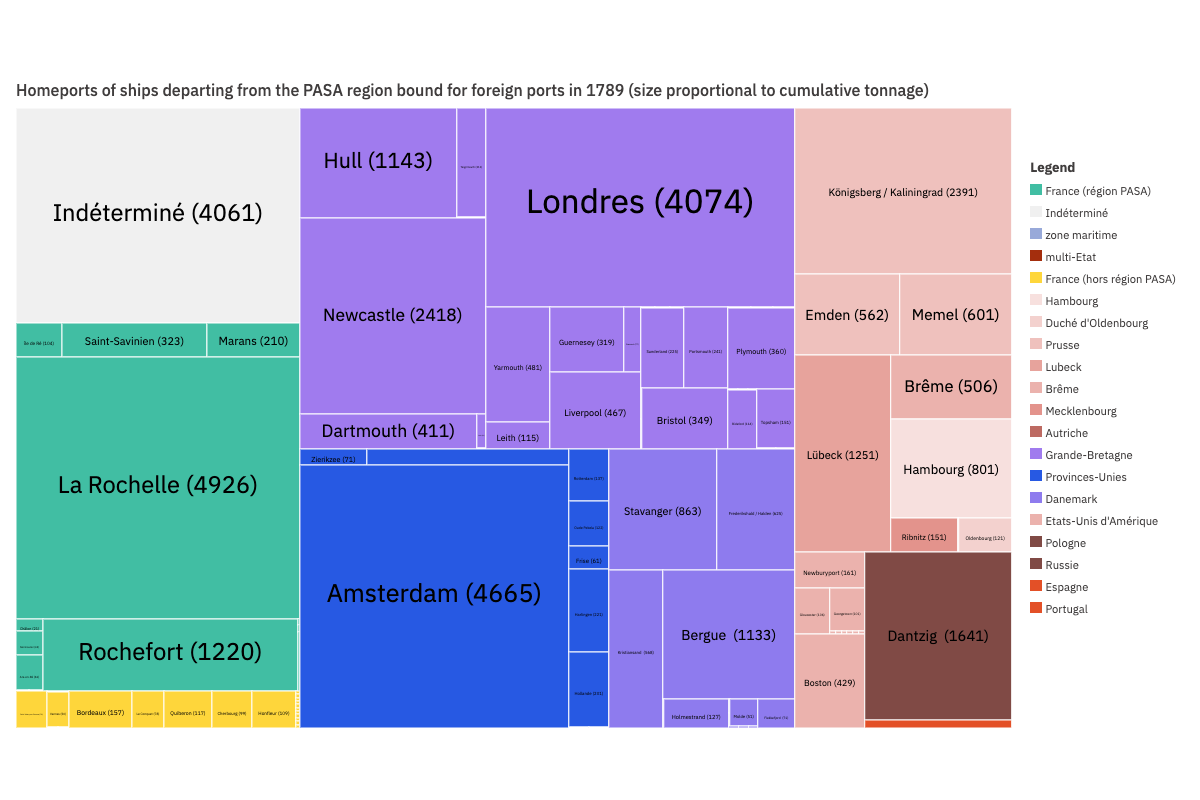
Home port of ships sailing to another country in 1789
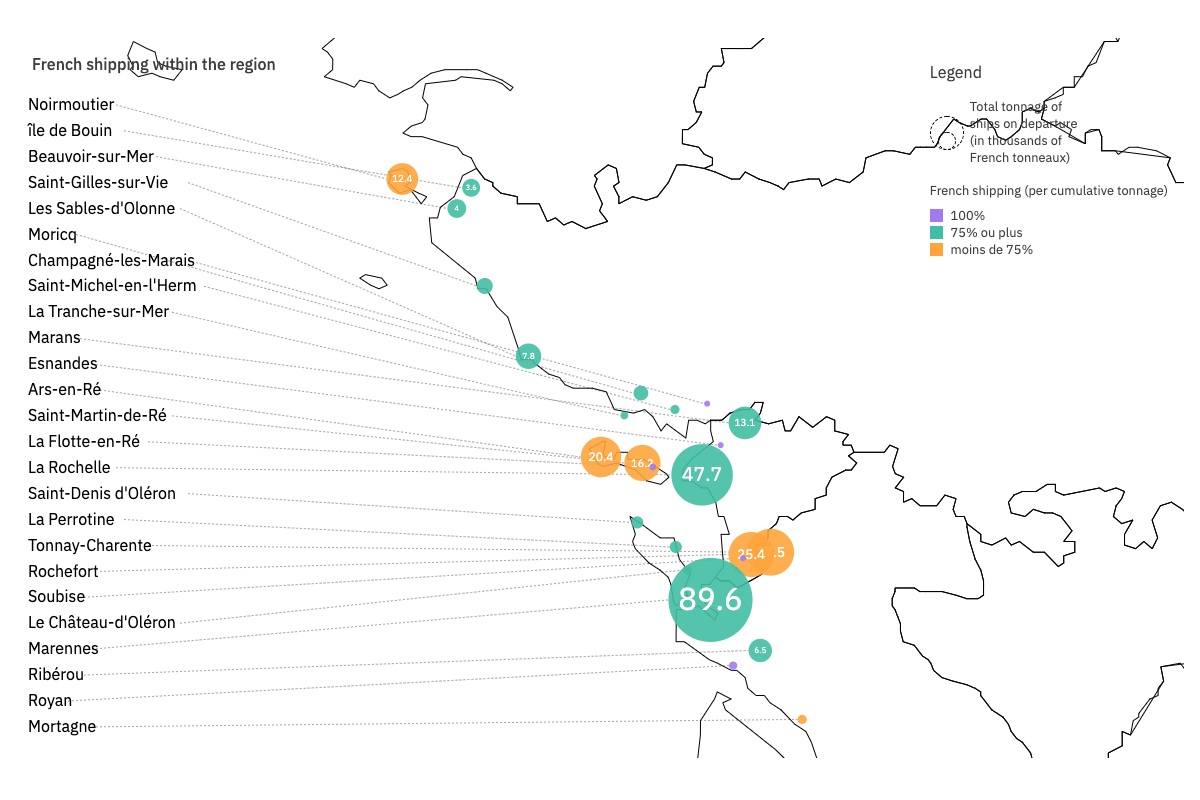
Share of French navigation in the region
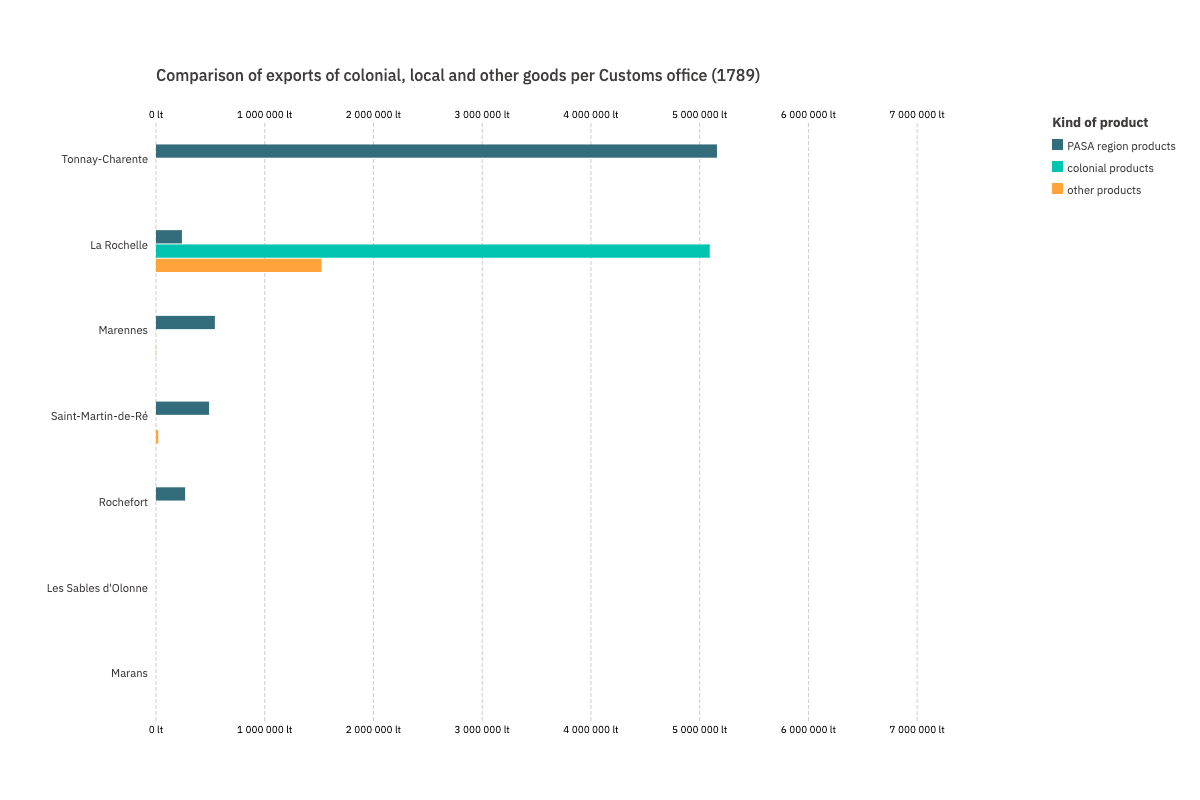
Comparison of colonial, local, and other exports by customs office
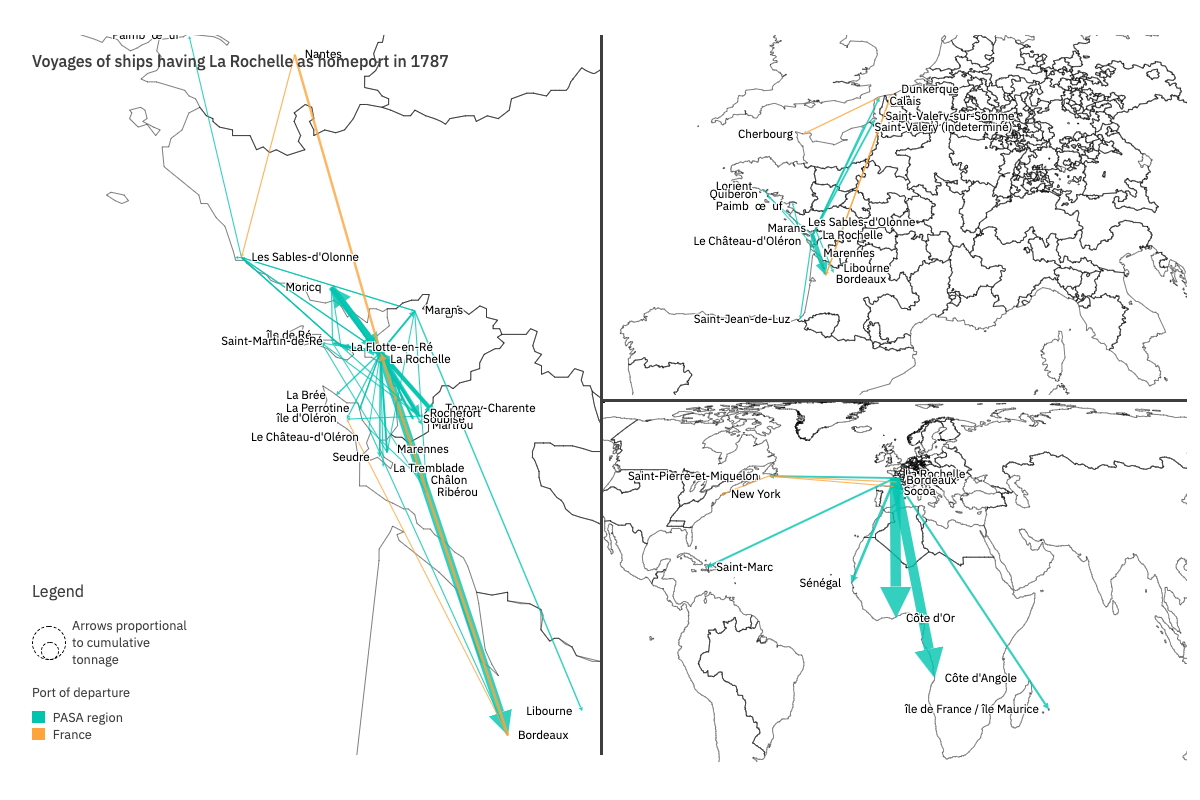
Flows of ships outfitted by the port of La Rochelle in 1787
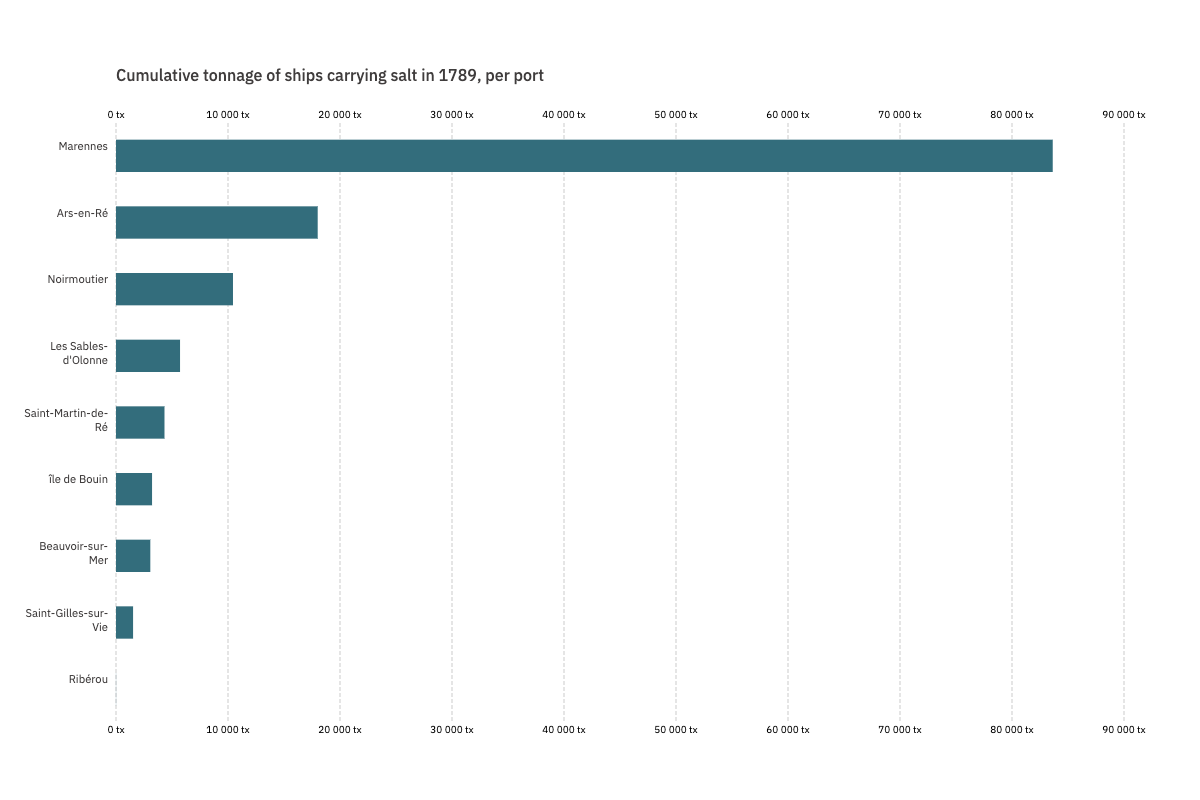
Ports of departure of vessels transporting salt in 1789 from the PASA region, aggregated by cumulative tonnage
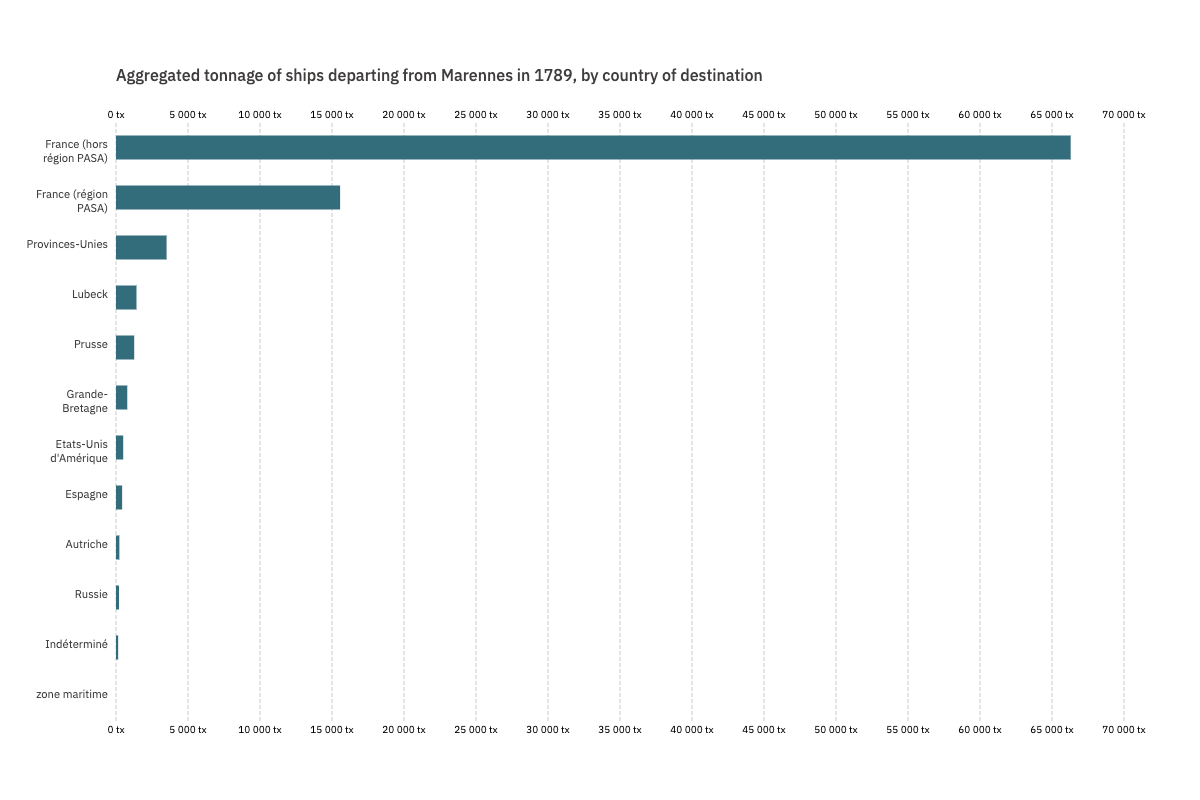
Destination of ships departing from Marennes in 1789, aggregated by country and by cumulative tonnage
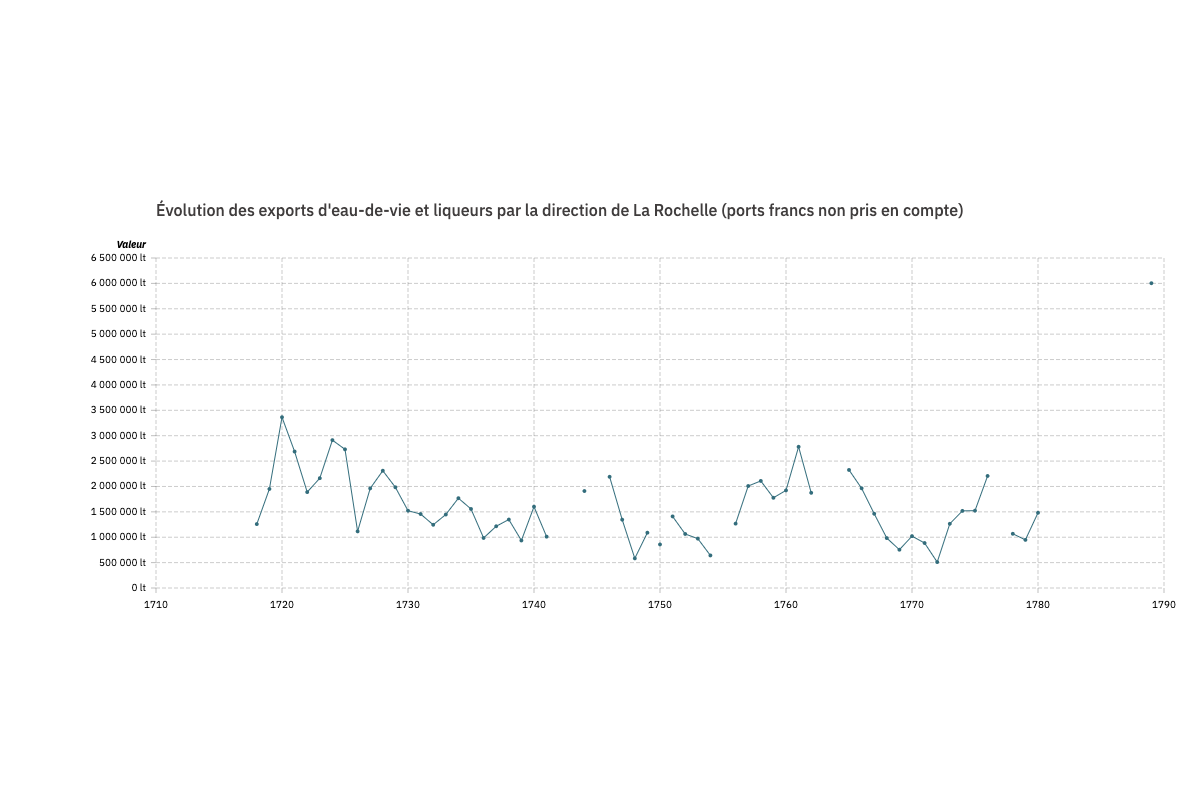
Evolution of brandy exports from the La Rochelle customs region (free ports not included)
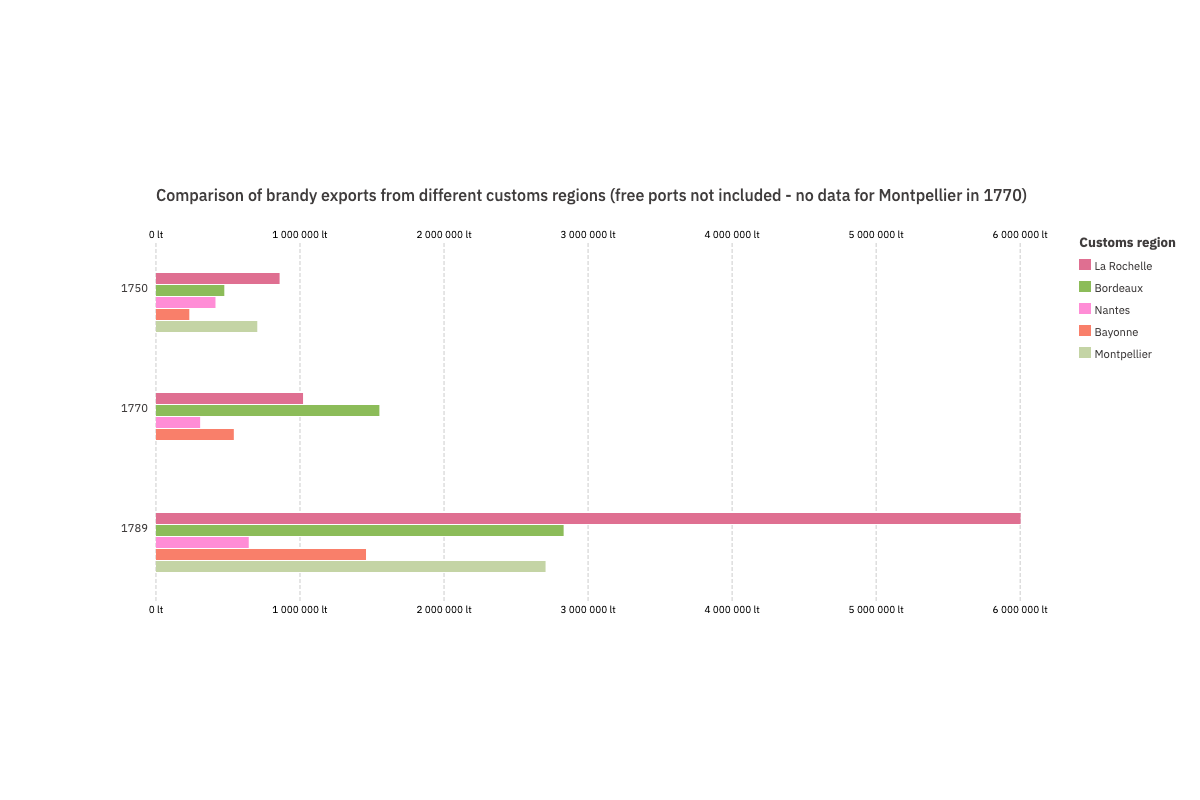
Comparison of brandy exports from different customs regions (free ports not included - no data for Montpellier in 1770)
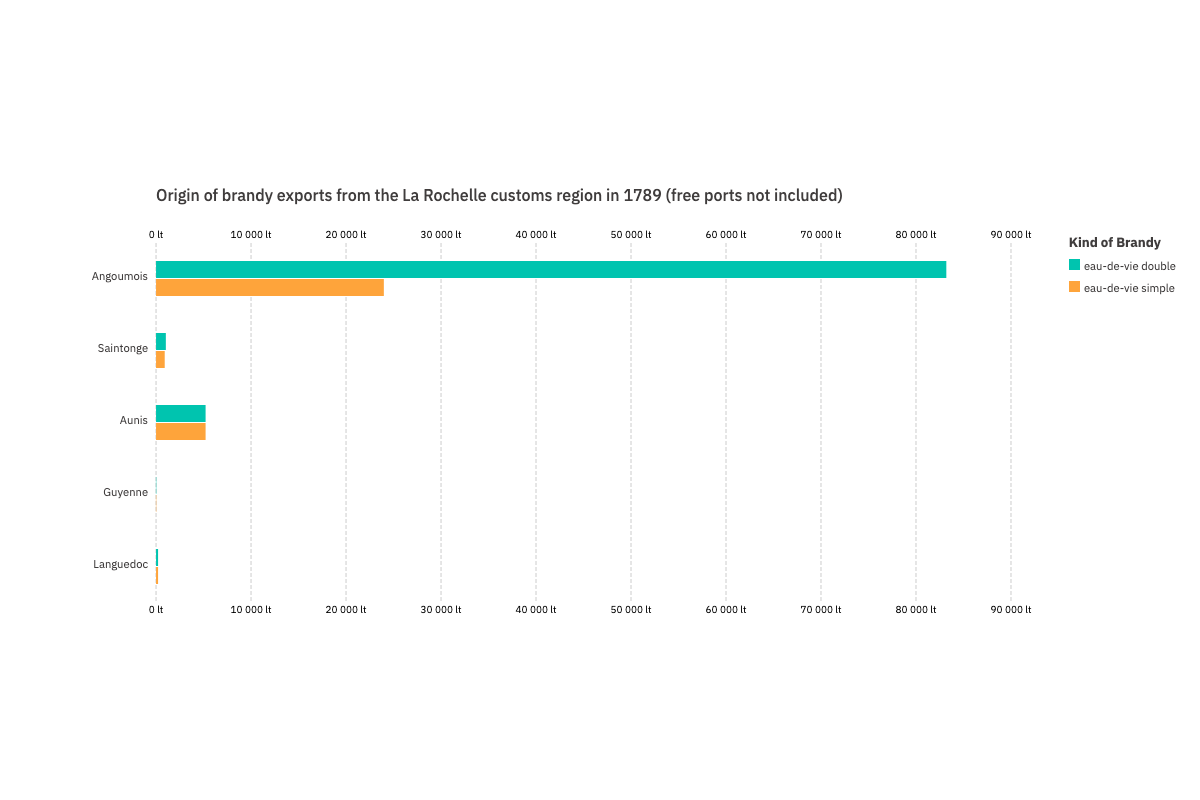
Origin of brandy exports from the La Rochelle customs region in 1789 (free ports not included)
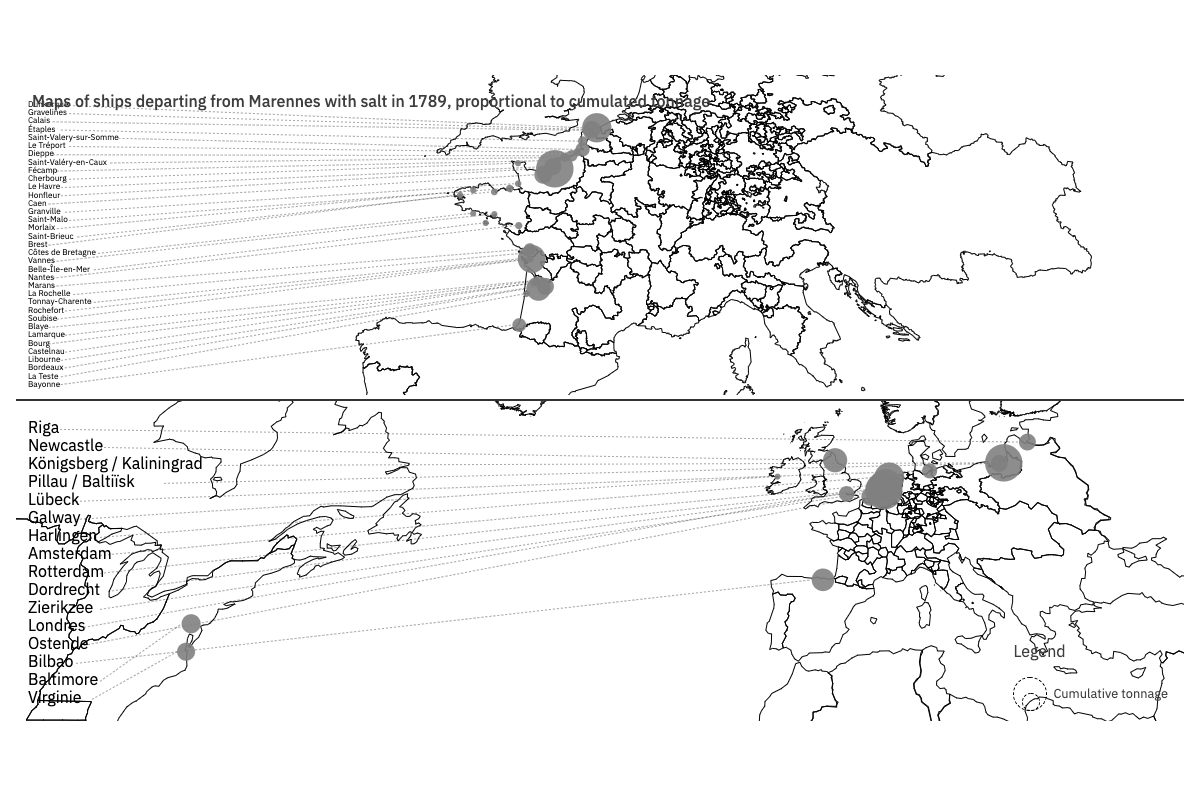
Maps of ships leaving Marennes with salt in 1789, sized by cumulative tonnage
Highly specialized ports: the slave trade, the salt trade, and the brandy trade
How were the data and visualization produced ?
Alluvial plot data was drawn from the Toflit18 database and concern all trade with foreign countries (free ports were not included). The flows were drawn from the "Best Guess customs region prod x partner" sources which provide information for each customs region (rather than all of France). The products and partners displayed in the chart were aggregated to highlight specialized circuits (and to match in a relatively identifiable way one or several customs offices with a type of product and a group of partners).
Data for the second chart (radar plot) was drawn from the Navigocorpus database. The flows originating from ports attached to the La Rochelle customs region were included. Destinations were grouped using the same classification as the first chart to allow a comparison between the two (iterative aggregation starting from the ports of destination).
How to read the visualization?
How to read the alluvial chart: the chart presents all exports from the region (top) and imports to the region (bottom). The left side shows the distribution by product (in value) of the trade of each customs office in the PASA region and the right side shows the distribution by external partner. It shows that La Rochelle mainly exported colonial products. The destination of colonial products is undetermined. Tonnay-Charente mainly exported brandy. Brandy was mainly exported to Great Britain and Europe. This chart shows the products in which each PASA customs office specialized and the preferred destination and origin of each product. <br>How to read the radar plot: the chart presents all the ships leaving the ports of the region studied. Their tonnage is expressed in tonneaux (i.e., a volume of 1.44 cubic meters). Using the slider, you can select a smaller tonnage range and only focus, for example, on vessels of more than 100 tonneaux. Similarly, by checking the different boxes, you can view information limited to subsets of ports belonging to one or more customs offices of the region examined. The radar plot then changes to only show the groups of destinations of vessels with the selected tonnage leaving from ports in the selected customs office. When hovering over the radar plot, a box appears with the share of each group of destinations. Destination ports were grouped here using the Toflit18 Balance of Trade categories to make it easier to compare the navigation database with the foreign trade value database.